|
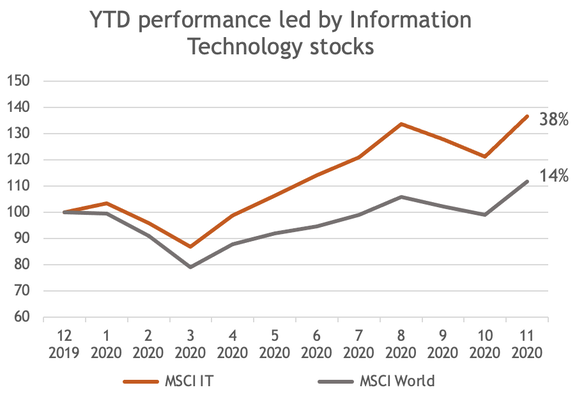
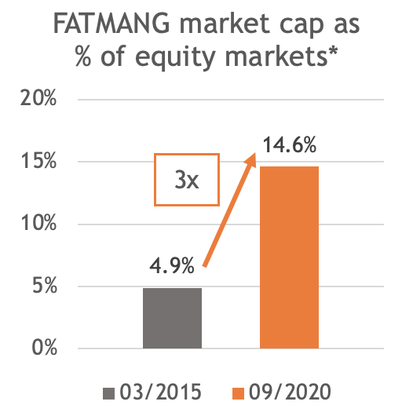
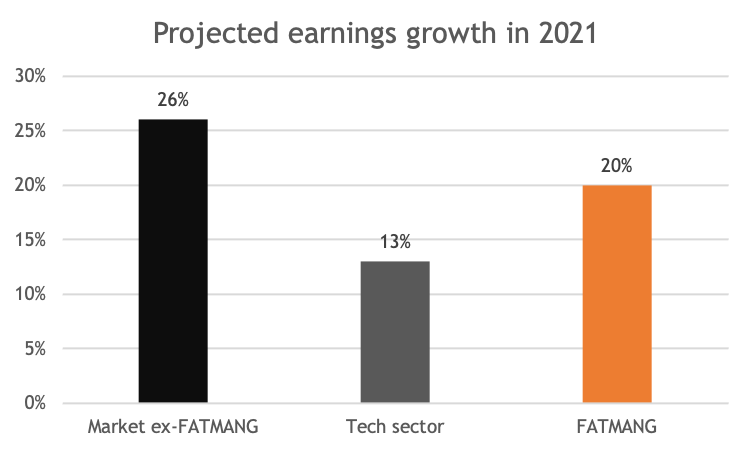
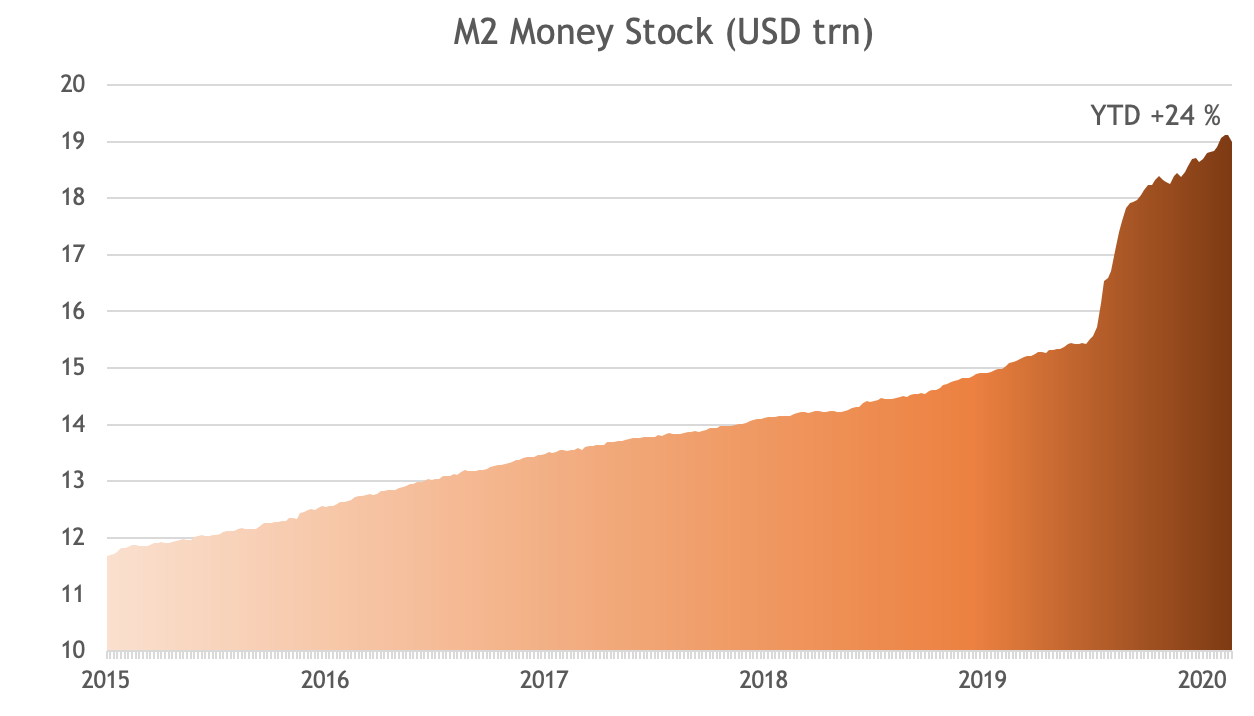
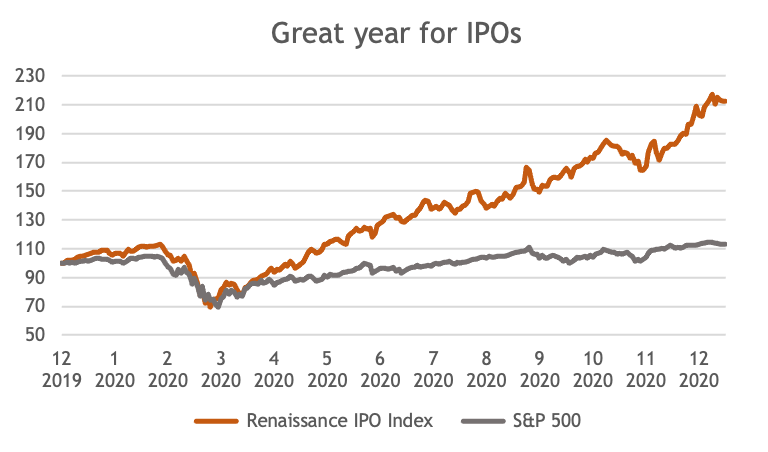
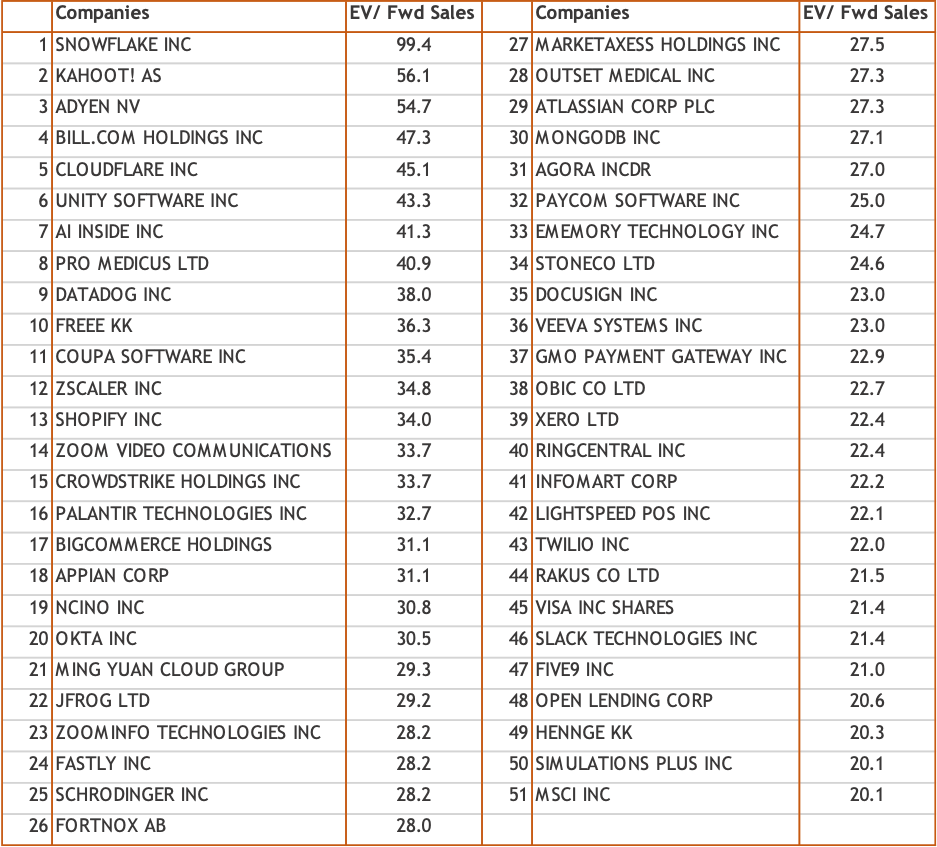
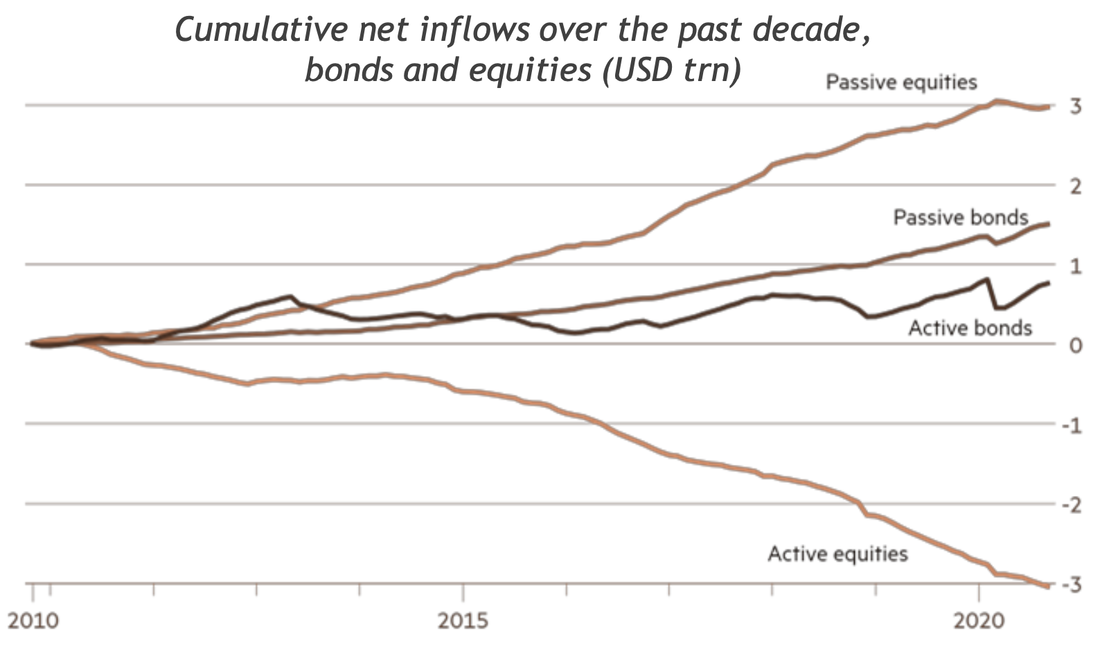
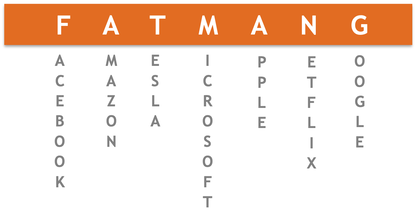
A look at FATMANGs & the Digital Acceleration Tech bull market driven by lockdowns and monetary stimulus … Twenty years ago, the Y2k.com bubble burst after technology stocks had appreciated by more than 630 % over the five years before, an advance of more than four times the overall market. The poster child stock of this bubble was Cisco which reached a market cap of USD 550 bn, trading at 35x trailing sales. The shares subsequently lost 90 % from peak to trough, and never recovered Y2k levels. Many other highfliers of that period disappeared completely or continue to linger around at much lower levels. This year, technology shares were leading the 2020 rally by advancing 38 % versus the overall market being only up only 14 % year-to-date. In a pandemic, the need for more digital tools to communicate, interact and transact has been a strong tailwind for the industry. Over the last five years, the tech sector has risen more than 200 %, roughly three times the market. Figure 1. MSCI IT versus MSCI World, Source: Bloomberg That leads to the question if this is just another bubble: an echo-bubble of what has happened twenty years ago as a new generation of investors entered the market? A new generation without bad memories of the post-2000 sell-off and excited by the digital acceleration stories so plentiful these days. Comparing the respective numbers over five years, a 200 % increase till 2020 for technology versus 630 % in the Dotcom bubble, it looks at first glance that this time there is still a long way to go to reach the excesses of 2000. Back then the sector traded at 81x trailing earnings versus “only” 36 now. However, focusing on the tech sector alone disregards companies from other industries such as Amazon which are also tech-driven businesses. … is translating into outsized tech stock gains The cheerleaders of the 2020 advance have been the FATMANG* group, the FAANGs plus Tesla and Microsoft. Tesla is probably the poster child of this rally, up 14-fold over the last five years and trading at 21x trailing sales. The FATMANG basket has advanced 58 % this year and 390 % over the last five years. The group is trading now at 108x trailing and 56x forward earnings. Given the tremendous growth of its members, its market cap share of world equities has tripled from 5 % to 15 % since 2015 (see figure 2). * FANG has been the established acronym for the four big tech leaders since some years. With the change of name from Google to Alphabet, the group should be called FANA and instead of FATMANG AFATMAN. Fat pitches is a term often used in trading, but we have refrained to go for A FAT MAN for obvious reasons. Figure 2. Source: Bloomberg, HCP Asset Management, * as measured by the Bloomberg Developed Market Index 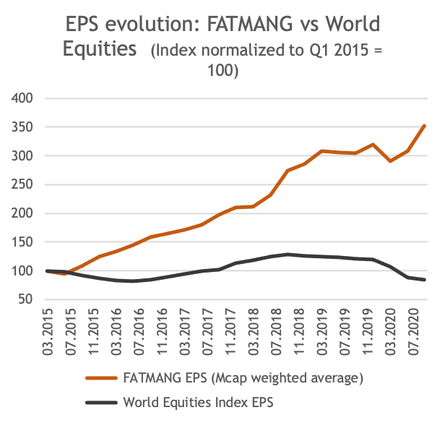 The key reason behind this increase: There was no earnings growth outside of FATMANG as figure 3 documents. With growth being scarce, investors flogged to these companies and paid up for them. Figure 3. Source: Bloomberg, HCP Asset Management This means nothing else that very few stocks have driven earnings growth for world equities over the last years and have also propelled market indices higher. If any of those giants were to struggle in the future, it will likely have a strong impact on the major indices. Key risks to consider For next year, analysts forecast for the first time in a while a significantly stronger earnings growth outside of FATMANG, namely 26 % versus 20 % for this tech leader group, and 13 % for the overall tech sector (see figure 4). While this is because of a lower base in 2020 for non-tech shares, it may lead to a rotation away from FATMANG in 2021. Figure 4. Projected earnings growth, Source: Bloomberg With these companies continuing to grow their share of the market, regulatory concerns have become louder. While this so far has been mainly a European issue, we now see such developments also in the US as well. Key clients (e.g., Fortnite, Expedia) have voiced concerns about the dominant position of the US tech giants. The US has little interest in hurting the industry which has been the key success for them over the last twenty years, but the more smaller US companies get negatively impacted, the more likely regulatory action will be. We could possibly see some of the following actions: Facebook may have to spin off Instagram and WhatsApp. Google may have to part from YouTube, Chrome and Android. Apple may be forced to cut the fees in their app store. Amazon may have to spin off Amazon Web Services, and Microsoft its cloud business. Furthermore, any data regulation may severely change the whole dynamics of every advertising business. Hence, investors need to very carefully monitor the upcoming regulatory action. We may first see only monetary penalties but would not be surprised that some of the above more drastic actions will be implemented. The FATMANG basket has started to underperform since the US election. While it is early days, it may be a sign of things to come. SPACs, IPOs and New Kids on the Block The drastic increase in money supply with measures such as M2 being up 24 % year over year has been leading to an asset inflow into financial markets. Figure 5. M2 stock, Source: FRED 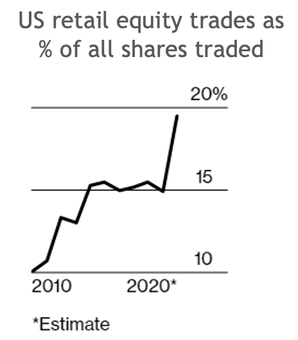 The popularity of retail investing has increased tremendously over the last decade, spiking in 2020. Ever lower fees, lockdown boredom, a lack of sports betting and casino gambling, fintech developments and new regulation allow and motivate more and more people to open their own online trading accounts. Retail investors historically represented 10-14% of the market. Now their share almost reached 20% on average and 25% on peak trading days. Figure 6. Bloomberg Intelligence 02.12.2020., FT.com 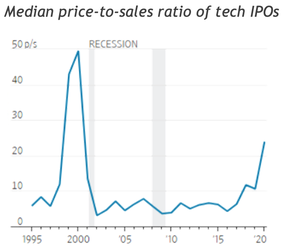 Figure 7. Source: Jay Ritter, University of Florida IPOs have been seeing their best year since 2000. For those who cannot wait for the proper due diligence of an IPO, the possibility of a reverse merger via a special acquisition company or SPAC has become immensely popular. Companies such as Nikola or Virgin Galactic chose that latter way. IPOs such as Airbnb saw their prices popping 100 % on day one, and the Renaissance Index of IPOs had its best year since 2000. It looks like a lot of companies which only recently claimed that being private is the best in the world, used the opportunity to become a publicly listed firm. Figure 8. Renaissance IPO Index, Source: Bloomberg New disruptors such as Snowflake trade at 100 times forward sales (see figure 7 for the trend in price-to-sales ratios for IPOs). Snowflake can grow into its valuation as its sales are projected to increase seven-fold over the next three years – implying a more “normal” sales multiple of 15 by 2023. We all know that new disrupting companies shall be valued off their market opportunity and not near-term sales, but we have identified currently fifty companies trading at more than 20x forward estimated sales. Not all will be winning, and a lot is priced in as their combined market cap is already USD 1.7 trn. Table 1. List of companies trading above 20x forward sales, as of 14.12.2020, Bloomberg Of course, we see a digital acceleration driven by the pandemic. However, the buyers of technology also need a budget, and typically transformations take longer than hoped by the sellers. Hence, projected growth rates may not be realized, leading to valuation resets in these highfliers. Another key risk is that in case the stock market sees a melt-up from here, the Fed will be forced to pullback monetary support, especially in the light of more intense inequality discussions. It is not about value or growth The pace of technological innovation will, however, lead to a demise of business models which cannot adopt. There has been an intense discussion when value will turn around and start to outperform growth stocks again. A company valued cheaply on the market but not able to adapt, will stay a value trap and eventually die. The key differentiation for stock pickers in the coming years will be to identify those companies which benefit most from the digital transformation by implementing the tools necessary for this shift. The narrow leadership has helped passive asset management Who needs an active asset manager if you simply buy the FATMANG basket and outperform markets? With these names taking a larger percentage in the indices, passive management is supported – until everyone is in and the trend turns. Or until these companies start to underperform the market in terms of earnings growth... Figure 9. Active outflows, passive inflows, Source: FT.com Conclusion The market has been driven mostly by a very small number of tech giants over the last years, even if it got broader recently. In this viewpoint, we highlighted the risks to a continuation of that trend. This is a risk particularly for passive investors and index huggers. On top of that, speculative action in markets has increased, and regulatory changes are becoming more likely. Hence, investors need to weigh those risks going forward carefully, keeping in mind the potential rotation away from tech. At HCP, now entering the fifth year of our strategy, we believe that our focus on high free cash flow and good balance sheets is also a measure of risk control. The digital innovation push triggered by the pandemic may very well lead to an increase in productivity, leading to a new wave of growth out of this crisis and propel the market further up. We are looking forward to a stabilization and healthy recovery of cash flows and earnings in 2021.
Legal disclaimer
This document is a marketing document and is intended for informational and/or marketing purposes. This material does not constitute an offer or solicitation in any jurisdiction where or to any person to whom it would be unauthorized or unlawful to do so. The views expressed are the views of HCP Asset Management through the period ending November 2020 and are subject to change at any time based on market and other conditions. References to specific securities and issuers are for illustrative purposes only and are not intended to be and should not be interpreted as recommendations to purchase or sell such securities. This Product does not represent a participation in any of the collective investment schemes pursuant to Art. 7 ff of the Swiss Federal Act on Collective Investment Schemes (CISA) and thus does not require an authorization of the Swiss Financial Market Supervisory Authority (FINMA). Therefore, Investors in this Product are not eligible for the specific investor protection under the CISA. Moreover, Investors in this Product bear the issuer risk. This Product is linked to a notional dynamic basket, which is actively managed in the sole discretion of the Reference Portfolio Advisor pursuant to the Portfolio Description Document. This document (Final Terms) constitutes the Simplified Prospectus for the Product described herein; it can be obtained free of charge from UBS AG, P.O. Box, CH-8098 Zurich (Switzerland), via telephone (+41-(0)44-239 47 03), fax (+41-(0)44-239 69 14) or via e-mail ([email protected]). The relevant version of this document is stated in English; any translations are for convenience only. For further information please refer to paragraph «Product Documentation» under section 4 of this document.
1 Comment
|
AuthorBolko Hohaus Archiv
December 2023
Categories |
||||||


 RSS Feed
