QT - The end of the debt rush Quantitative Tightening (QT) has arrived In June, the US Fed has started to shrink its balance sheet by letting treasuries and mortgage-backed securities (MBS) mature without reinvesting the proceeds. The pace of this tightening is supposed to accelerate significantly this month, with the amount rolling off the balance-sheet doubling compared to June. As Powell indicated that QT should last two to two ½ years, the total amount the Fed’s assets are supposed to shrink is about 2-2.5 trillion US-$, versus the current assets of US-$ 9 trn (that equal 40 % of US GDP). Any effects on liquidity may not arrive immediately as it depends who is the buyer of newly issued treasuries but net treasury supply is also estimated to triple to 1.5 trn a year versus the pre-Covid year 2019. The Fed already owns a third of all outstanding treasuries and may not be able to continue its purchases at the same pace. Over time, the impact of QT on liquidity is, therefore, likely very restraining, influencing upward pressure on bond yields. Chart 1 shows how QE has not only lifted M2 but also equity markets as the latter inflected upwards with increased money supply. Hence, the opposite effect over the QT period seems quite possible. 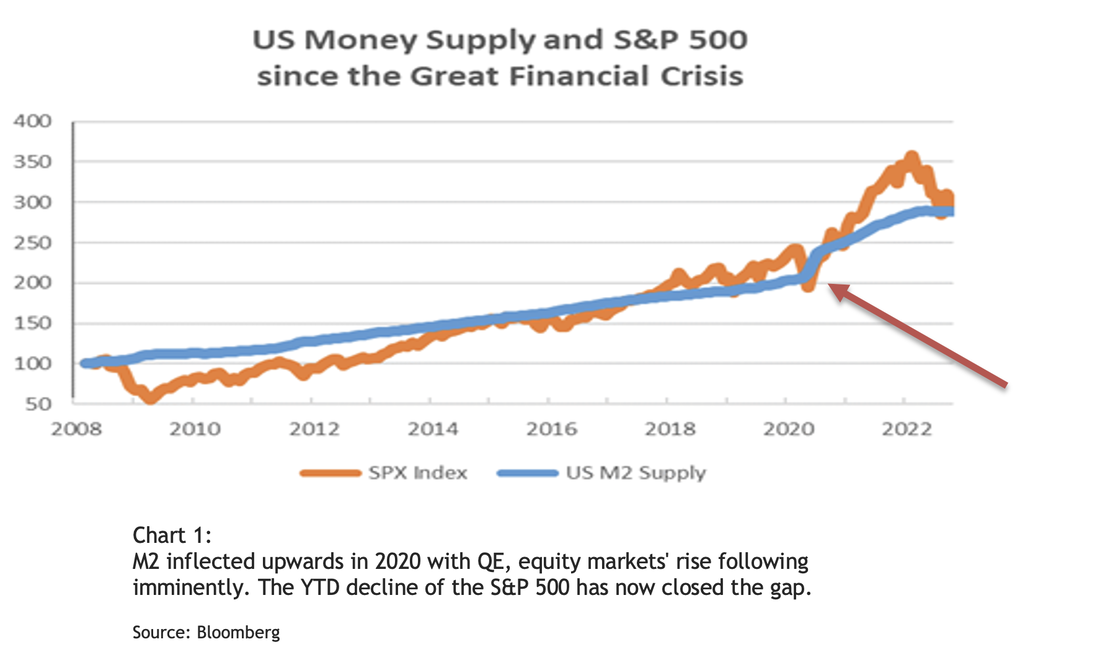 Low interest rates lead to market participants taking on more debt While the interest burden is relatively low given the S&P 500 net debt to EBITDA ratio of 1.2, corporate debt as % of GDP is now 10 %-points higher than at the end of the great financial crisis (see chart 2). With rates rising fast, there is a risk that part of the debt becomes unbearable over the next few years. If EBITDA was to drop by one third in a recession, net debt to EBITDA would rise to 1.8 – a still acceptable level for the average company but this is only the average. Consequently, balance sheets will become important again in selecting companies as many will run into trouble in a recession. 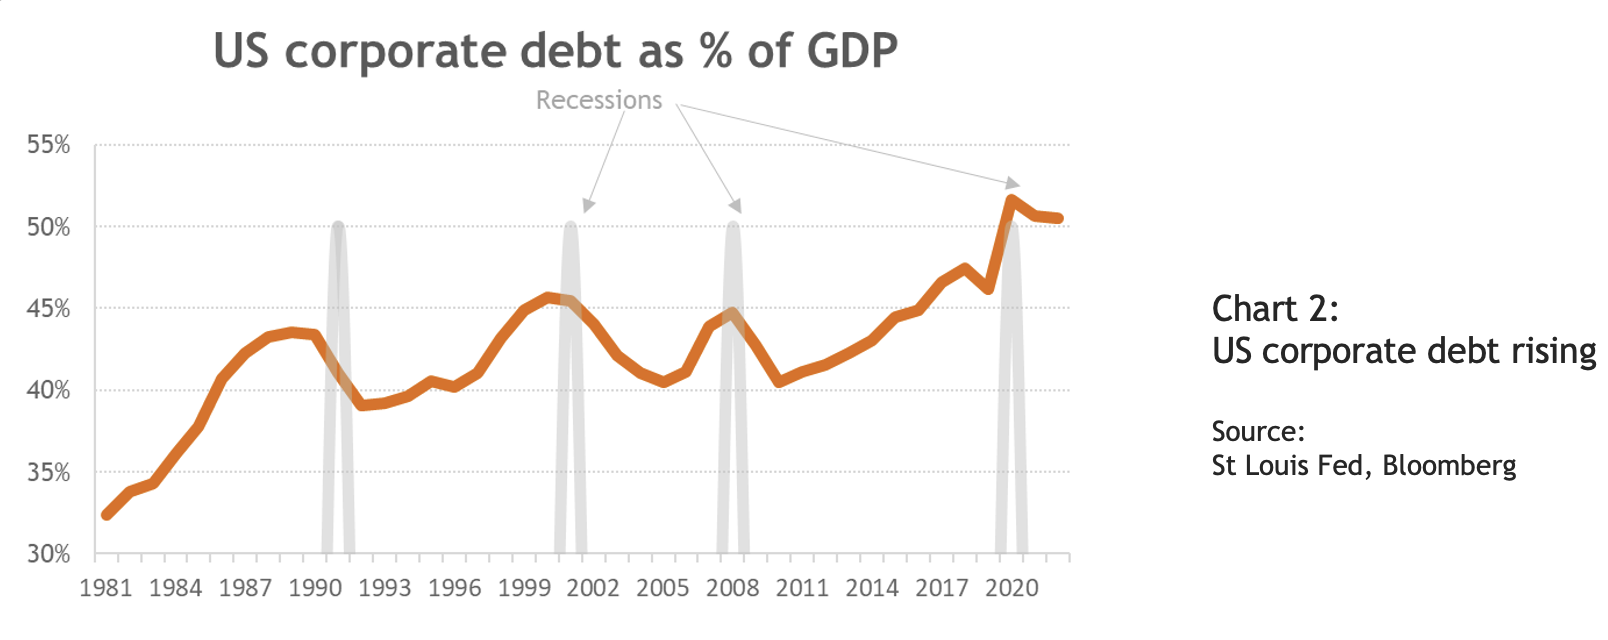 Global debt levels rising On a global level, debt, especially public debt, saw a huge increase during the pandemic (see chart 3). This likely implies higher taxation and lower net profit margins down the road. On the other hand, governments have now every incentive to keep interest rates lower, implying fiscal repression tactics to become more common. 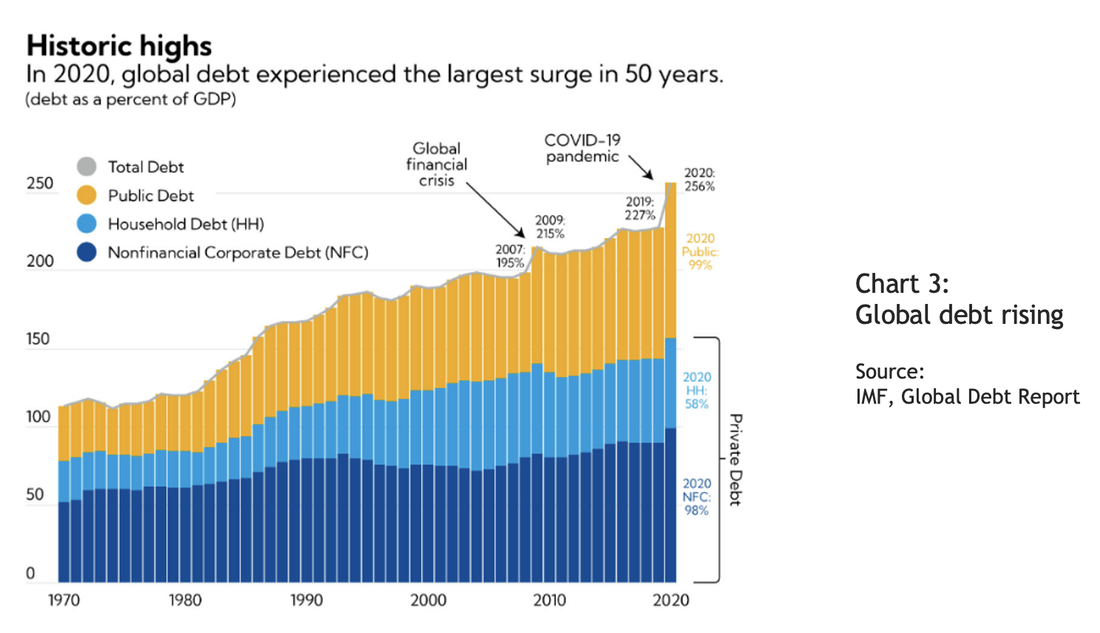 Investors rushing out of companies without debt Many companies used the period of low interest rates to shore up its cash balances by issuing debt over the last two years. That has lead to a very unusual underperformance of those companies with cash (chart 4). We expect this anomaly to disappear again, and requires investors to adapt. 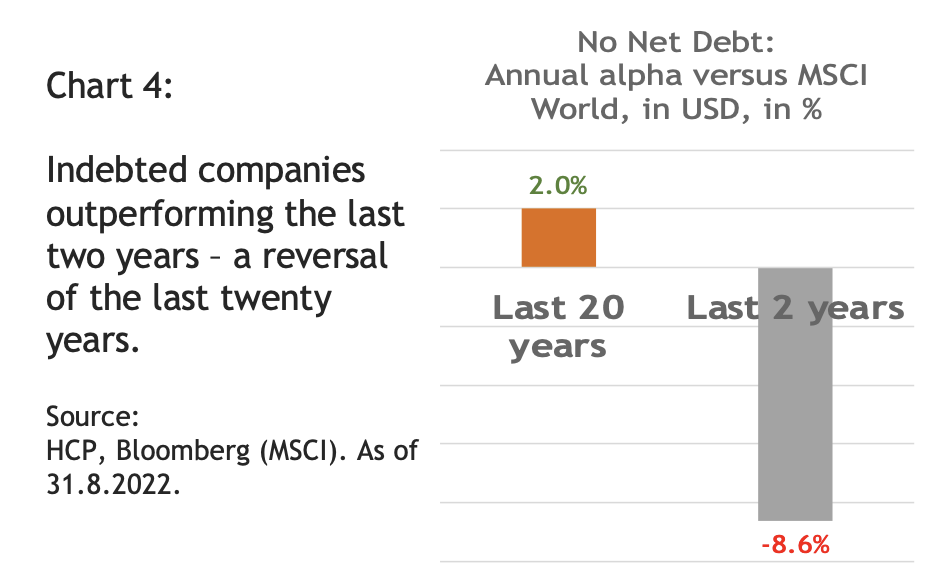 Conclusion: QT likely to impact market for some time – balance sheets to matter again Higher rates are a headwind for equities as the rise in the discount factor reduces the current value of future cash flows. This implies that investors should change focus from highly-priced growth stocks to market segments with valuation support. Furthermore, balance sheet quality, as measured by net cash, has been largely ignored by investors in the pandemic world. With QE ending and QT starting, this should normalize again. Human beings tend to perceive the world in a linearly; hence we are still in the early innings of this adjustment process. 
 Photo by Greg Rosenke on Unsplash They said it is different this time Early February, we published our viewpoint ”Time for a change?” in which we argued that a rotation away from the highfliers of 2020 was very likely and probably imminent. Equity income stocks were trading at a uniquely attractive entry point, only seen twice before in the last thirty years. Since then, the Russell 2000 growth index fell 12 %, while the MSCI High Dividend Index advanced 11 % (see chart one). This is a spectacular delta of 23 % in a bit more than three months - time to revisit our thesis. We argue in this viewpoint that we are still early in a transition that is likely to last for many years to come, if not the next decade. Over the last five years, the Russell growth index has (erase) outperformed the MSCI High Dividend index by more than 70 %. The delta in favor of technology over that period was even a proper 200 %. As valuation for disruption stocks skyrocketed in 2020, taking profits and reinvesting the money in attractively valued equities seems to be a prudent move. 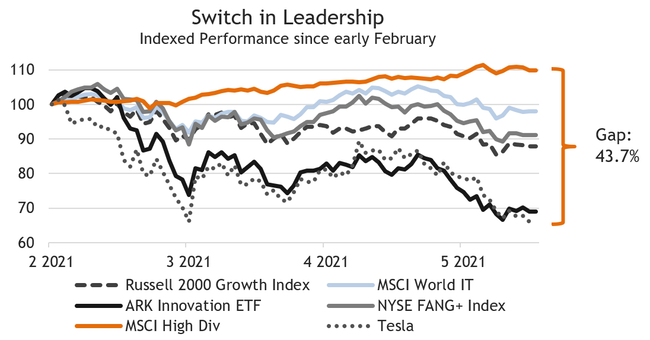 Chart 1: Growth is lagging, Equity Income leading Source: HCP, Bloomberg (Russell 2000 Growth. MSCI World High Dividend). Start Date is 5.2.2021, the publication of our last HCP viewpoint. Digital detox and the real stuff getting scarce We all know that we live in disruptive times and that the pandemic accelerated the digital adoption. However, investors priced many technology companies for very strong growth over long time periods. Scores of companies profited from being seen as concept stocks with no need to show profitability. The share of those money-losing companies reached levels last time seen in the Y2K bubble. However, in the imminent grand reopening, humans are likely to digitally detox. Companies need to get their hands on materials such as steel, lumber or copper to build their products. Higher input prices here will leave them with less budget for the rest, such as technology. Consumers also just upgraded their home office and technology gear. That does not imply IT budgets will shrink in 2021, but their growth rate is likely to decline from a year that showed a tremendous acceleration. This will be a strong headwind for technology stocks. Tech earnings lagging In 2021, the technology sector will lag in terms of relative earnings growth versus the overall market. To smooth the rebound effect of 2021, we aggregated in chart two the numbers for 2021 and 2022. Technology is still expected to grow less than the market over this longer period. This is true both for revenues and earnings. At the same time, the technology sector trades at a significant valuation premium that a price to earnings growth ratio does not seem to justify. Furthermore, the well-known mega-tech companies Facebook, Apple, Amazon, Google are potentially facing anti-trust action and higher tax rates from governmental efforts to restrict the current global tax optimisation. Therefore, it will be critical to watch the development of this group of companies as they were a key driver of earnings growth for the sector over the last five years (in our last viewpoint, we showed that the FATMANG group actually contributed all of the sector’s earnings growth). 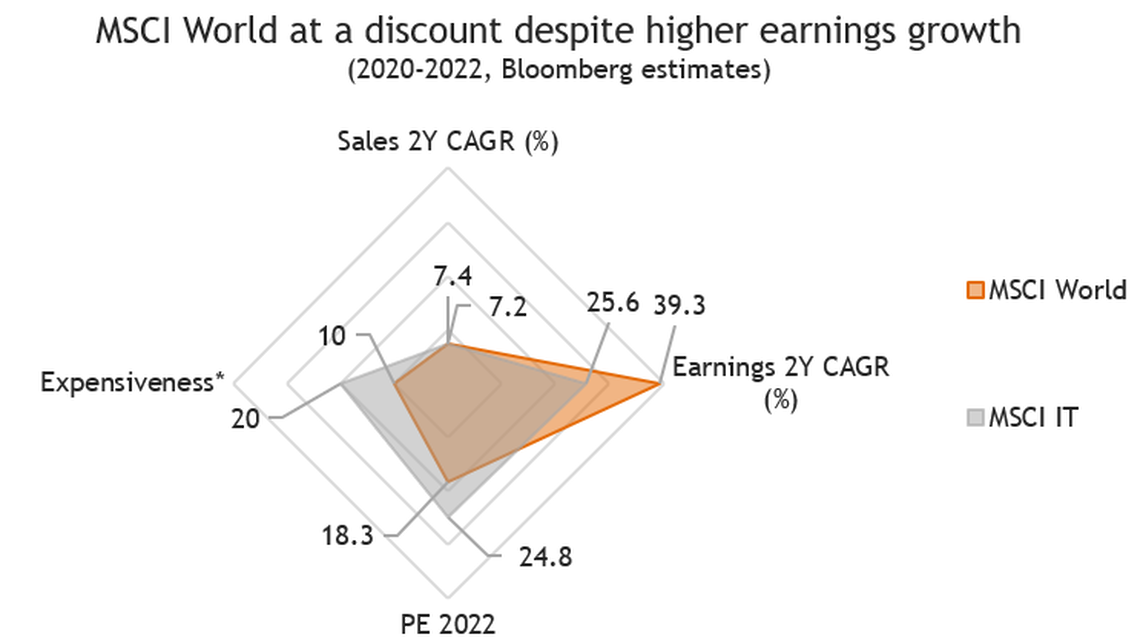 * Rescaled PEG 2022 calculated as 20x PE Ratio to 2-year CAGR of estimated EPS Chart 2: Technology earnings growth lagging in 2020-2022 (Source: HCP, Bloomberg) Tighter regulation a key threat On top of the slower near-term tech earnings, tighter regulation is becoming a reality for the sector. The new US administration has nominated Lina Khan as Federal Trade Commissioner (FTC), an outspoken tech critic. The US department of justice has an anti-monopoly case running against Alphabet, and the FTC sued Facebook for illegal monopolization. At the same time, Apple gets attacked by Fortnite producer Epic for its app store take rates that are deemed excessive by smaller content owners and have brought Apple tremendous traffic growth. Amazon is just considering acquiring MGM, entering a new business area (film production). With the tech giants expanding, conflicts with smaller companies and anti-trust concerns are likely to become more widespread. However, the exact timing of any governmental action and what type of actual measures will be taken are uncertain. The regulator may break up the large tech companies or restrict data collection as consumer concerns are constantly rising. Furthermore, the US administration has proposed a minimum tax rate of 15 %, undermining the global tax optimization efforts of the tech giants. It seems safe to assume that the median tax rate for large companies that halved over the last thirty years will not fall further. The S&P is soon 50 % tech; Tech is half FAMANG (Facebook, Apple, Microsoft, Amazon, Netflix, Google) Passive investors that buy an S&P tracker should be aware that soon half of the index consists of tech or tech-related (i.e. communication services) companies (see chart 3). In that calculation, we did not even include firms such as Tesla, seen by some as a technology company powering the operating system of the mobile society of the future. Furthermore, half of the current market cap of technology-related stocks consists of the FAMANG stocks. Hence, the fate of those companies will determine the direction of the sector in the future. We are all aware of the performance of the tech giants over the last few years, but historically, half of the top 20 companies did not make it to that group a decade later. Hence, some caution towards the FATMANG group might be appropriate. 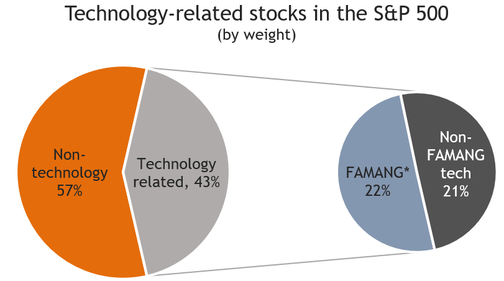 * Not including Tesla Chart 3: Tech heavy S&P 500; FAMANG half of technology Source: HCP, Bloomberg (S&P 500) The implications are two-fold. Once the large-cap techs struggle, technology and the S&P are likely to be under pressure. Secondly, passive investing may lose the decade-long tailwind from the bigger companies taking share – an excellent opportunity for active asset managers may arise. Worthwhile to consider equity income for contrarians What other parts of the market may take the leadership in 2021 in a world that hopefully will recover from the pandemic during the year? Looking at Chart 4, we can see that equity income stocks still trade close to a multi-decade low versus the overall market – measured by the MSCI High Dividend versus the MSCI World. In our view, it is an excellent opportunity to re-evaluate this universe as the last time that the index traded close to such a discount to the broad market, the equity income index started a multi-year outperformance. Since we had written about this in early February, the MSCI High Dividend Index has outperformed the Russell 2000 growth index by more than 2000 basis points! This move is barely visible on the chart, indicating that this reversal has only started with a lot of potential for the following years, in our view. 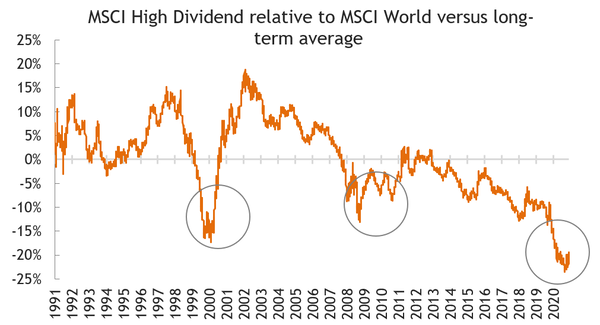 Chart 4: MSCI High Dividend versus MSCI World still close to all-time lows Source: HCP, Bloomberg (MSCI) Conclusion: It is unlikely to be different this time; the rotation has only started With the market trading like a thirty-year bond with a 2 % yield as some describe it, higher rates will be a headwind as the rise in the discount factor reduces the current value of future cash flows. This implies that investors should change focus from highly-priced growth stocks to market segments that have valuation support. Given the vast outperformance in technology stocks over the last years and the change of relative earnings growth patterns, we believe that it is time to start allocating to other equity universe buckets. Equity income shares are trading close to an all-time low versus the overall market. The last time this has happened, the fate reversed for many, many years in a row. That does not mean that one has to invest in any high dividend stock blindly. Every investment needs to be carefully screened if the underlying company has still a viable business model and can generate strong cash flows over time. In a portfolio, it makes sense, in our opinion, to have a barbell strategy that, on one side, focusses on innovation as long as valuations for the selected companies are realistic. Still, now an equity-income portion seems to be a very attractive addition on the other side of equities’ risk spectrum. The outperformance of this segment has already started, but we outlined why we think it is still early, in our view. Disclaimer: This document is a marketing document and is intended for informational and/or marketing purposes. This document is addressed solely to Recipients to whom it has been delivered by HCP Asset Management SA (“HCP”). It may not be distributed in whole or in part to any other persons without the prior written consent of HCP. All Recipients take full and sole responsibility for compliance with applicable laws and regulations in relation to any use they make of the Document. This Document contains information about the certificate but does not constitute an issuance prospectus pursuant to articles 652a or 1156 of the Swiss Code of Obligations, article 7 ff. of the Swiss Federal Act on Collective Investment Schemes or a similar law or regulation. The complete information on the certificate, including the relevant risks, can be obtained from the simplified prospectus, which can be retrieved from www.ubs.com/keyinvest and which constitutes the sole binding basis for an investment decision. The Document is for general informational purposes only. Nothing contained in this Document constitutes legal, tax or investment advice. The information in this Document does not constitute an offer, solicitation or recommendation to buy or to sell the certificate or any other financial instruments, or to engage in any other transaction involving financial instruments. Before making an investment decision the Recipient should always read all relevant legal documents (e.g. the simplified prospectus) as well as any other material which might be required under local laws and regulation, especially all relevant risk disclosures contained therein, and seek professional advice. Any investment decision lies in the sole responsibility of the Recipient. Past performance is no guarantee for future performance. HCP provides no guarantee whatsoever pertaining to the future performance of the certificate. Although the Document is based on information that HCP considers to be reliable, HCP does not guarantee that the content is accurate, up-to-date or complete. HCP may amend the Document partly or entirely at any time without prior notice. HCP is not obliged to provide the Recipients with an amended version of the Document.
  Is it different this time? In 2020, the upside in markets had been mainly in thematic, mostly technology equities. The technology sector index advanced 44 %, outpacing the broad market’s gain of 17 % by a wide margin. A pandemic-driven acceleration of the already ongoing digital disruption trend led to a significantly higher sector valuation as technology was seen as a safe haven. Despite this, aggregated sector revenues and earnings were falling year over year in 2020. Hence, investor priced in higher expectations for the future. With vaccines hitting the market at this very moment, it seems likely that investors’ focus will shift to other areas during 2021. Please read on to learn what are arguments against and for this change of focus, and what our opinion is. The pandemic has created for every company and organization the need to implement a clear digital strategy. Often this was even a question of survival for the pandemic-affected entities. The consequent redirection of budgets to digital projects has accelerated growth for many technology companies in 2020 and beyond as projects are rolled out over time. However, on a sector level, there was no revenue and earnings growth for technology last year. For those companies gaining last year revenue share, year over year comparisons in 2021 will become tougher while at the same time valuations often price in a rosy picture for many years to come. Markets tend to look for accelerating growth, the second derivative, for those highfliers. It creates a significant challenge to the sector’s leaders’ forward performance. Earnings growth dispersion To get a clearer picture, let us look at the composition of equity markets’ earnings growth over the last five years. There was no earnings growth outside of the well-known mega-tech companies (called FATMANG or Facebook, Apple, Tesla, Microsoft, Amazon, Netflix, Google), see chart 1. Therefore, it will be critical to watch the development of this group of companies. 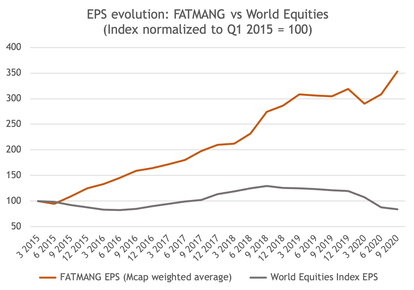 Chart 1: A world without earnings growth – except the FATMANGs Source: HCP, Bloomberg (MSCI World) Tech sector with subpar earnings in 2021 & tighter regulation a key threat What may be a surprise to many: according to consensus tech sector earnings in 2021 will lag the market. Even the FATMANG group’s earnings growth will not keep up with the rest of the market. Hence, 2021 will be the first year for more than five years, where the relative growth trajectory between FATMANG and the market reverses. Given their share of the market (around 15 % of the total market capitalization), this could significantly affect indices. On top of that, tighter tech regulation is becoming more likely. Even in the US, we see initiatives with that goal. However, the exact timing and what type of actual measures will be taken are uncertain. The regulator may break up the large tech companies, or restrict data collection. However, it is not only the governments that are looking to take actions. The recent changes in WhatsApp’s general conditions initiated by its parent company Facebook have triggered a massive outflow of clients to alternatives such as Telegram, Signal or Threema. It clearly shows that users are becoming increasingly wary of sharing data with Big Tech. If users were to demand money for sharing data, the tech giants’ model could dramatically be challenged. 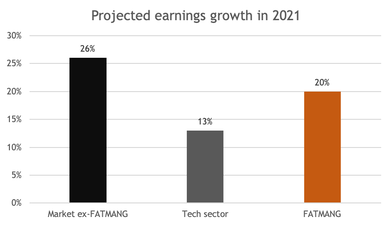 Chart 2: Technology earnings growth lagging in 2021 Source: HCP, Bloomberg Worthwhile to consider equity income for contrarians What other parts of the market may take the leadership in 2021, in a world that hopefully will recover from the pandemic during the year? Looking at Chart 3, we can see that equity income stocks trade at a multi-decade low versus the overall market – measured by the MSCI High Dividend versus the MSCI World. In our view, it is an excellent opportunity to re-evaluate this universe as the last time that index traded close to such a discount to the broad market, the equity income index started a decade-long outperformance. 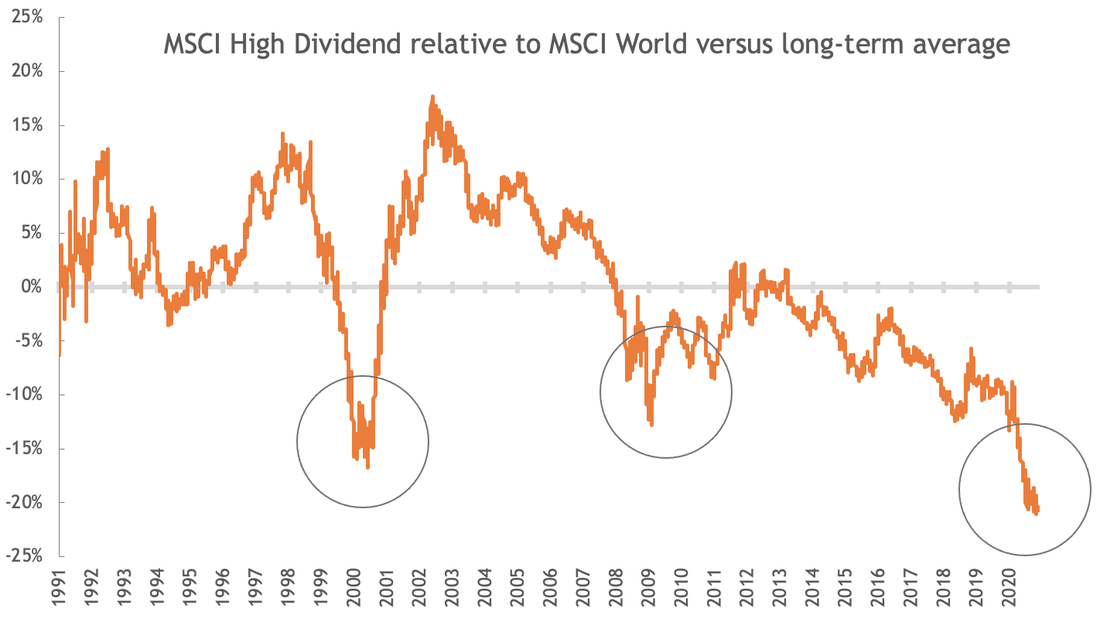 Chart 3: MSCI High Dividend versus MSCI World at all-time lows Source: HCP, Bloomberg (MSCI) Conclusion: The odds are that it is not different this time Given the vast outperformance in technology stocks over the last years and the change of relative earnings growth patterns, we believe that it is time to start allocating to other equity universe buckets. Equity income shares are trading at an all-time low versus the overall market. The last time this has happened, the fate reversed for many, many years in a row. That does not mean that one has to invest in any high dividend stock blindly. Every investment needs to be carefully screened if the underlying company has still a viable business model and can generate strong cash flows over time. In a portfolio, it makes sense, in our opinion, to have a barbell strategy which on one side focusses on innovation as long as valuations for the selected companies are realistic. Still, now an equity-income portion seems to be a very attractive addition on the other side of equities’ risk spectrum. Disclaimer: This document is a marketing document and is intended for informational and/or marketing purposes. This document is addressed solely to Recipients to whom it has been delivered by HCP Asset Management SA (“HCP”). It may not be distributed in whole or in part to any other persons without the prior written consent of HCP. All Recipients take full and sole responsibility for compliance with applicable laws and regulations in relation to any use they make of the Document. This Document contains information about the certificate but does not constitute an issuance prospectus pursuant to articles 652a or 1156 of the Swiss Code of Obligations, article 7 ff. of the Swiss Federal Act on Collective Investment Schemes or a similar law or regulation. The complete information on the certificate, including the relevant risks, can be obtained from the simplified prospectus, which can be retrieved from www.ubs.com/keyinvest and which constitutes the sole binding basis for an investment decision. The Document is for general informational purposes only. Nothing contained in this Document constitutes legal, tax or investment advice. The information in this Document does not constitute an offer, solicitation or recommendation to buy or to sell the certificate or any other financial instruments, or to engage in any other transaction involving financial instruments. Before making an investment decision the Recipient should always read all relevant legal documents (e.g. the simplified prospectus) as well as any other material which might be required under local laws and regulation, especially all relevant risk disclosures contained therein, and seek professional advice. Any investment decision lies in the sole responsibility of the Recipient. Past performance is no guarantee for future performance. HCP provides no guarantee whatsoever pertaining to the future performance of the certificate. Although the Document is based on information that HCP considers to be reliable, HCP does not guarantee that the content is accurate, up-to-date or complete. HCP may amend the Document partly or entirely at any time without prior notice. HCP is not obliged to provide the Recipients with an amended version of the Document.
 Where to generate income in this low-yield world? Imagine a saver with one million CHF in assets approaching her retirement and wanting to generate steady, not too risky returns from her savings. In the past, she would have invested the majority of her capital in bonds: mostly Swiss government bonds, some non-Swiss bonds, some corporates. These times are over with Swiss and German government bonds yielding -0.5 %, and even high-quality corporate bonds like Nestlé negative at -0.2 %. Of course, she could turn to high-yield bonds which currently offer 4.2 % in the US and 2.6 % in Europe. However, in a world with ever-increasing debt levels, this implies investing in highly leveraged companies in often structurally challenged sectors. Losing only one investment in a portfolio of thirty bonds erases the whole return, not even thinking about a blow-out in spreads which could create capital losses of twenty percent plus. Given that lack of alternatives, HCP has developed an innovative approach that has shown to deliver consistent returns since its inception in 2016. We call it the “Premium Equity Income Approach”. In our core strategy, this portfolio has paid a dividend of 6 % every year out of its annual total return of around 12 %. The saver in our example would have received a yearly dividend of 60’000 CHF and achieved additional capital gains of the same amount. The even better news is that the pay-out consists mostly of capital gains and is, therefore, income-tax-free for Swiss citizens. Where else can savers in need of sustainable income find these kind of yields in liquid instruments? Snails and more How is this possible? HCP carefully selects roughly thirty global companies that are not leveraged and generate sustainably high free cash flow. That way, the investors get exposure to a well-diversified equity portfolio of healthy companies with great balance sheets. As a total, that portfolio of companies generates a bond-like cash flow of more than 6 % p.a. despite those firms not being leveraged and not bearing major credit risks. One way to look at it would be a virtual 6 % paying bond of a group of companies with a top credit rating. However, as they do not have net debt, there is actually no credit rating for many of them. As those companies do not pay out 6 % on average, we augment our strategy by a yield enhancement on roughly one-third of our holdings. We call them “snails”, slow-moving, steadily cash-flow generating companies. On those rather boring stocks we sell call options and collect the call premium, which allows us to pay out the dividend that we target to be at least 5 % p.a. Over the first four years, we exceeded our objective and distributed 6 % p.a. Premium Equity Income Strategy in 2020 versus Equity Markets and High Yield Bonds How has our income-oriented strategy fared in a year like 2020? The HCP Premium Equity Income Certificate USD (PEIC) delivered a total return of +15.9 %, in-line with world equity markets but much better than the underlying universe that was flat in 2020 (as measured by the MSCI High Dividend). Notably, even the drawdown in March was one-third smaller than equity markets and in-line with defensive Swiss large caps such as Nestlé. Hence, in a challenging year, the focus on companies with healthy balance sheets and strong cash flows has proven to be again an excellent strategy to reduce risk while achieving significant returns. With bond yields collapsing, the search for yield has become more complex. We see clients increasingly using our strategy to replace their high yield bond allocations. Chart 1 shows that PEIC had a similar drawdown despite being a different asset class, but a total return twice that of the Global High Yield Index (+61 % versus +30 % since inception). 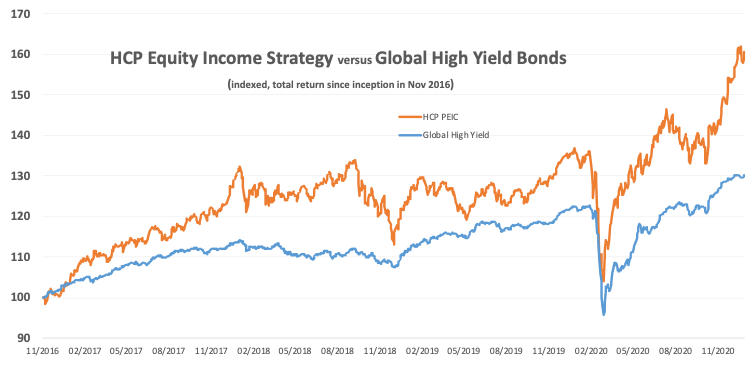 Chart 1: HCP’s income strategy as replacement for high yield bonds? Source: HCP, Bloomberg (Global Bond High Yield Index: Barclays) 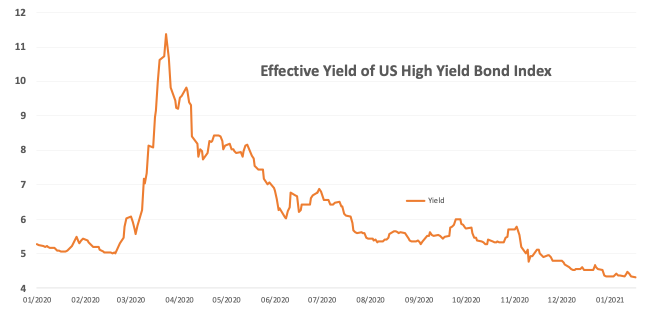 Chart 2: US High Yields trading at all-time low yields Source: HCP, Federal Reserve Bank of St. Louis (US High Yield) The ‘Hunt for Yield’ has driven the yield of high yield bonds to an all-time low (see chart 2). The move to lower yields has at the same time supported equities, especially growth stocks which now trade at meagre free cash flow yields. Businesses such as Adobe or Intuit are seen as stable enough to afford them a 40x cash flow multiple. They are like a bond proxy trading with a small 150 bps equity premium to the US long bond. Table 1 highlights a few stocks trading in that range. Many other high-flying stocks are not even profitable, but their valuation has dramatically increased as their discount rate has plummeted. Those valuations leave little cushion for error or a significant move higher in rates. Therefore, we advocate to focus on businesses with sustainable high free cash flow yields as their low valuation is more attractive and provides a margin of safety. 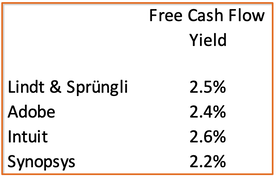 Table 1: Free Cash Flow yields of selected stocks Source: HCP, Bloomberg Conclusion: Low yields and the demographic-driven demise of the pension system require new solutions In a low-yield world, new investment solutions need to be found to secure income for investors in need of it. With increasing life expectancy, the pension system as it is currently constructed will likely fail to provide enough income for retirees. The HCP solution tries to address not only the shortfall of pensions stemming from the demographic challenges; it also offers a way to generate cash flow from an investment portfolio. This regular dividend can be used to pay for children’s or grandchildren’s education or back up an affordability calculation for a mortgage, to give only two examples. Notably, the equity market can be volatile over the short-run, but markets have historically always recovered over time. Therefore, we believe that HCP’s equity income approach deserves a place in investors’ asset allocation as a more defensive equity building block providing steady income. Disclaimer: This document is a marketing document and is intended for informational and/or marketing purposes. This document is addressed solely to Recipients to whom it has been delivered by HCP Asset Management SA (“HCP”). It may not be distributed in whole or in part to any other persons without the prior written consent of HCP. All Recipients take full and sole responsibility for compliance with applicable laws and regulations in relation to any use they make of the Document. This Document contains information about the certificate but does not constitute an issuance prospectus pursuant to articles 652a or 1156 of the Swiss Code of Obligations, article 7 ff. of the Swiss Federal Act on Collective Investment Schemes or a similar law or regulation. The complete information on the certificate, including the relevant risks, can be obtained from the simplified prospectus, which can be retrieved from www.ubs.com/keyinvest and which constitutes the sole binding basis for an investment decision. The Document is for general informational purposes only. Nothing contained in this Document constitutes legal, tax or investment advice. The information in this Document does not constitute an offer, solicitation or recommendation to buy or to sell the certificate or any other financial instruments, or to engage in any other transaction involving financial instruments. Before making an investment decision the Recipient should always read all relevant legal documents (e.g. the simplified prospectus) as well as any other material which might be required under local laws and regulation, especially all relevant risk disclosures contained therein, and seek professional advice. Any investment decision lies in the sole responsibility of the Recipient. Past performance is no guarantee for future performance. HCP provides no guarantee whatsoever pertaining to the future performance of the certificate. Although the Document is based on information that HCP considers to be reliable, HCP does not guarantee that the content is accurate, up-to-date or complete. HCP may amend the Document partly or entirely at any time without prior notice. HCP is not obliged to provide the Recipients with an amended version of the Document.
A look at FATMANGs & the Digital Acceleration  Tech bull market driven by lockdowns and monetary stimulus … Twenty years ago, the Y2k.com bubble burst after technology stocks had appreciated by more than 630 % over the five years before, an advance of more than four times the overall market. The poster child stock of this bubble was Cisco which reached a market cap of USD 550 bn, trading at 35x trailing sales. The shares subsequently lost 90 % from peak to trough, and never recovered Y2k levels. Many other highfliers of that period disappeared completely or continue to linger around at much lower levels. This year, technology shares were leading the 2020 rally by advancing 38 % versus the overall market being only up only 14 % year-to-date. In a pandemic, the need for more digital tools to communicate, interact and transact has been a strong tailwind for the industry. Over the last five years, the tech sector has risen more than 200 %, roughly three times the market. 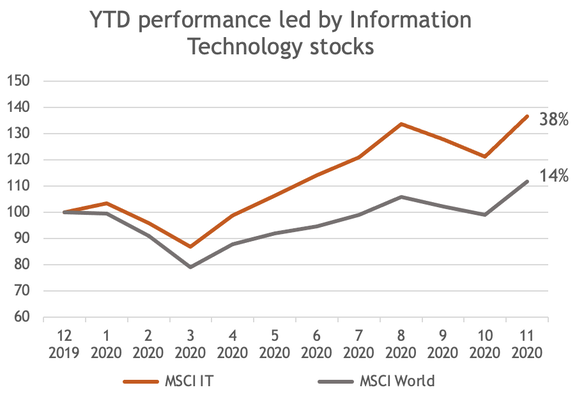 Figure 1. MSCI IT versus MSCI World, Source: Bloomberg That leads to the question if this is just another bubble: an echo-bubble of what has happened twenty years ago as a new generation of investors entered the market? A new generation without bad memories of the post-2000 sell-off and excited by the digital acceleration stories so plentiful these days. Comparing the respective numbers over five years, a 200 % increase till 2020 for technology versus 630 % in the Dotcom bubble, it looks at first glance that this time there is still a long way to go to reach the excesses of 2000. Back then the sector traded at 81x trailing earnings versus “only” 36 now. However, focusing on the tech sector alone disregards companies from other industries such as Amazon which are also tech-driven businesses. … is translating into outsized tech stock gains The cheerleaders of the 2020 advance have been the FATMANG* group, the FAANGs plus Tesla and Microsoft. Tesla is probably the poster child of this rally, up 14-fold over the last five years and trading at 21x trailing sales. The FATMANG basket has advanced 58 % this year and 390 % over the last five years. The group is trading now at 108x trailing and 56x forward earnings. Given the tremendous growth of its members, its market cap share of world equities has tripled from 5 % to 15 % since 2015 (see figure 2). * FANG has been the established acronym for the four big tech leaders since some years. With the change of name from Google to Alphabet, the group should be called FANA and instead of FATMANG AFATMAN. Fat pitches is a term often used in trading, but we have refrained to go for A FAT MAN for obvious reasons. 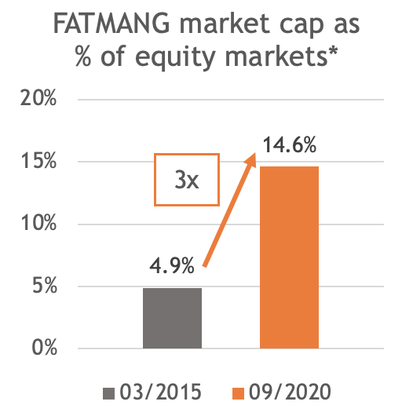 Figure 2. Source: Bloomberg, HCP Asset Management, * as measured by the Bloomberg Developed Market Index 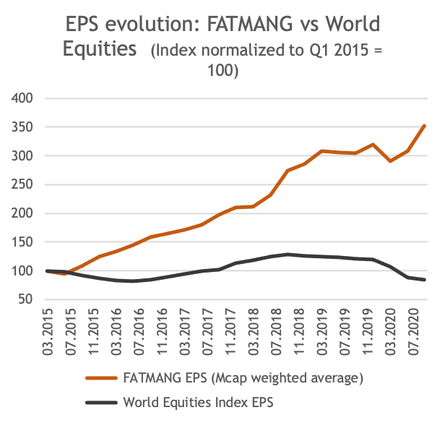 The key reason behind this increase: There was no earnings growth outside of FATMANG as figure 3 documents. With growth being scarce, investors flogged to these companies and paid up for them. Figure 3. Source: Bloomberg, HCP Asset Management This means nothing else that very few stocks have driven earnings growth for world equities over the last years and have also propelled market indices higher. If any of those giants were to struggle in the future, it will likely have a strong impact on the major indices. Key risks to consider For next year, analysts forecast for the first time in a while a significantly stronger earnings growth outside of FATMANG, namely 26 % versus 20 % for this tech leader group, and 13 % for the overall tech sector (see figure 4). While this is because of a lower base in 2020 for non-tech shares, it may lead to a rotation away from FATMANG in 2021. 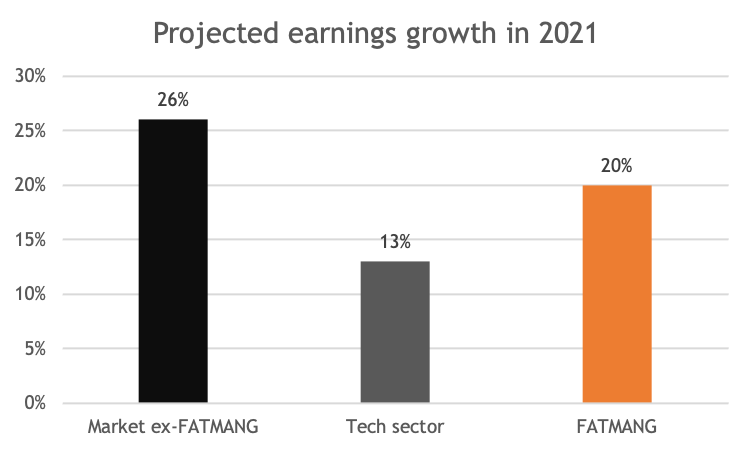 Figure 4. Projected earnings growth, Source: Bloomberg With these companies continuing to grow their share of the market, regulatory concerns have become louder. While this so far has been mainly a European issue, we now see such developments also in the US as well. Key clients (e.g., Fortnite, Expedia) have voiced concerns about the dominant position of the US tech giants. The US has little interest in hurting the industry which has been the key success for them over the last twenty years, but the more smaller US companies get negatively impacted, the more likely regulatory action will be. We could possibly see some of the following actions: Facebook may have to spin off Instagram and WhatsApp. Google may have to part from YouTube, Chrome and Android. Apple may be forced to cut the fees in their app store. Amazon may have to spin off Amazon Web Services, and Microsoft its cloud business. Furthermore, any data regulation may severely change the whole dynamics of every advertising business. Hence, investors need to very carefully monitor the upcoming regulatory action. We may first see only monetary penalties but would not be surprised that some of the above more drastic actions will be implemented. The FATMANG basket has started to underperform since the US election. While it is early days, it may be a sign of things to come. SPACs, IPOs and New Kids on the Block The drastic increase in money supply with measures such as M2 being up 24 % year over year has been leading to an asset inflow into financial markets. 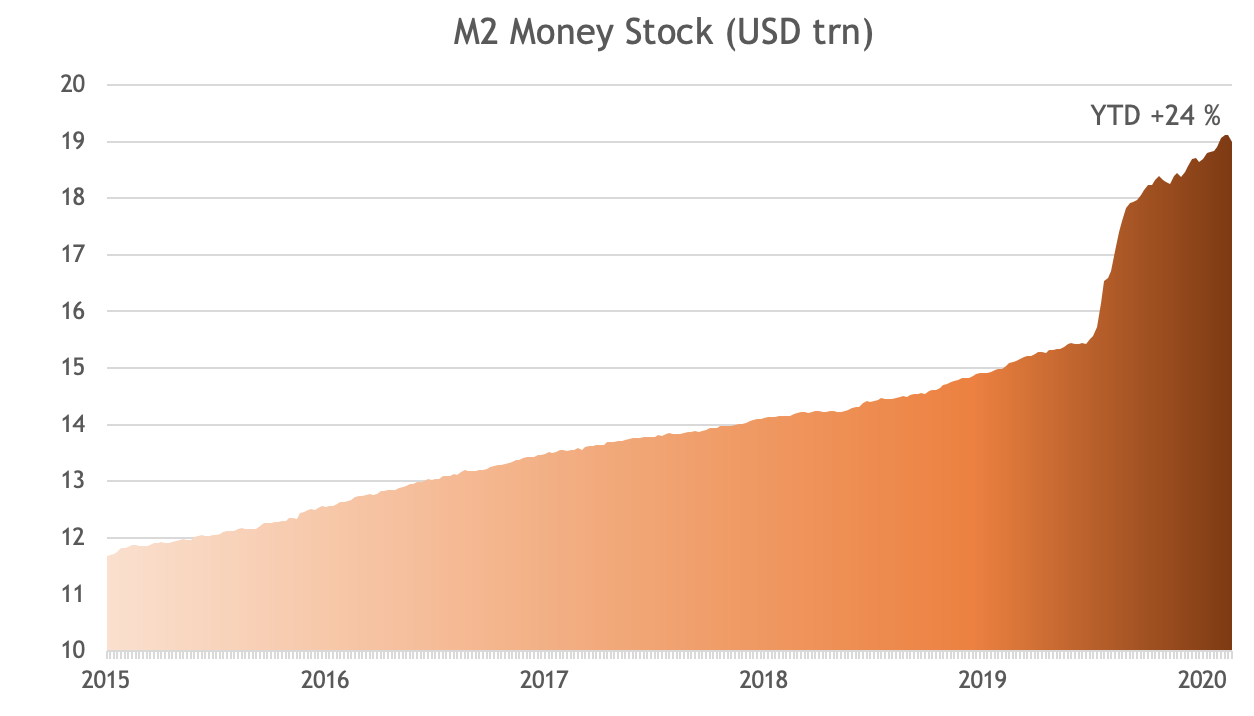 Figure 5. M2 stock, Source: FRED 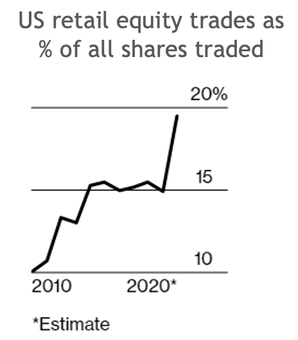 The popularity of retail investing has increased tremendously over the last decade, spiking in 2020. Ever lower fees, lockdown boredom, a lack of sports betting and casino gambling, fintech developments and new regulation allow and motivate more and more people to open their own online trading accounts. Retail investors historically represented 10-14% of the market. Now their share almost reached 20% on average and 25% on peak trading days. Figure 6. Bloomberg Intelligence 02.12.2020., FT.com 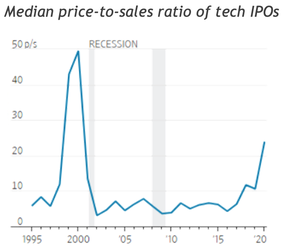 Figure 7. Source: Jay Ritter, University of Florida IPOs have been seeing their best year since 2000. For those who cannot wait for the proper due diligence of an IPO, the possibility of a reverse merger via a special acquisition company or SPAC has become immensely popular. Companies such as Nikola or Virgin Galactic chose that latter way. IPOs such as Airbnb saw their prices popping 100 % on day one, and the Renaissance Index of IPOs had its best year since 2000. It looks like a lot of companies which only recently claimed that being private is the best in the world, used the opportunity to become a publicly listed firm. 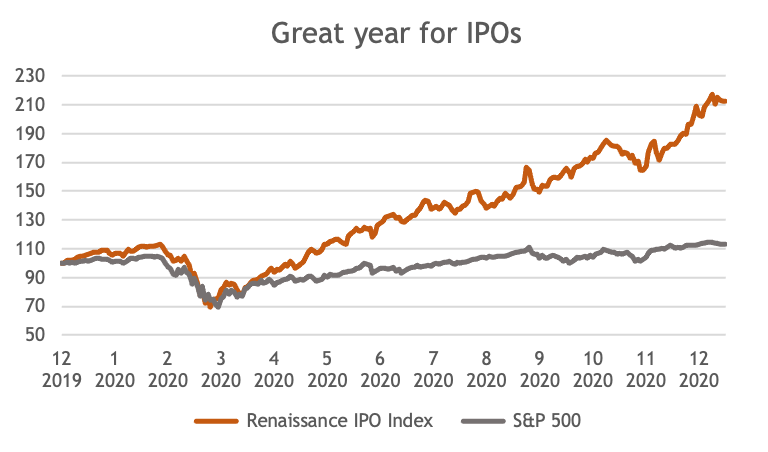 Figure 8. Renaissance IPO Index, Source: Bloomberg New disruptors such as Snowflake trade at 100 times forward sales (see figure 7 for the trend in price-to-sales ratios for IPOs). Snowflake can grow into its valuation as its sales are projected to increase seven-fold over the next three years – implying a more “normal” sales multiple of 15 by 2023. We all know that new disrupting companies shall be valued off their market opportunity and not near-term sales, but we have identified currently fifty companies trading at more than 20x forward estimated sales. Not all will be winning, and a lot is priced in as their combined market cap is already USD 1.7 trn. 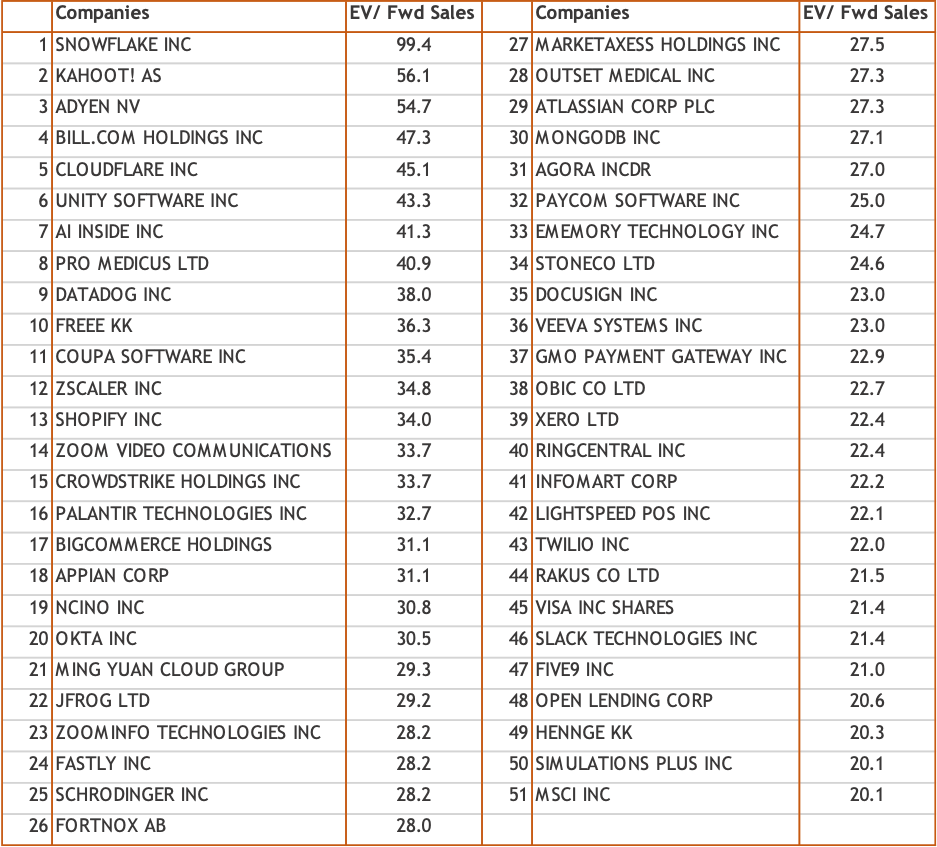 Table 1. List of companies trading above 20x forward sales, as of 14.12.2020, Bloomberg Of course, we see a digital acceleration driven by the pandemic. However, the buyers of technology also need a budget, and typically transformations take longer than hoped by the sellers. Hence, projected growth rates may not be realized, leading to valuation resets in these highfliers. Another key risk is that in case the stock market sees a melt-up from here, the Fed will be forced to pullback monetary support, especially in the light of more intense inequality discussions. It is not about value or growth The pace of technological innovation will, however, lead to a demise of business models which cannot adopt. There has been an intense discussion when value will turn around and start to outperform growth stocks again. A company valued cheaply on the market but not able to adapt, will stay a value trap and eventually die. The key differentiation for stock pickers in the coming years will be to identify those companies which benefit most from the digital transformation by implementing the tools necessary for this shift. The narrow leadership has helped passive asset management Who needs an active asset manager if you simply buy the FATMANG basket and outperform markets? With these names taking a larger percentage in the indices, passive management is supported – until everyone is in and the trend turns. Or until these companies start to underperform the market in terms of earnings growth... 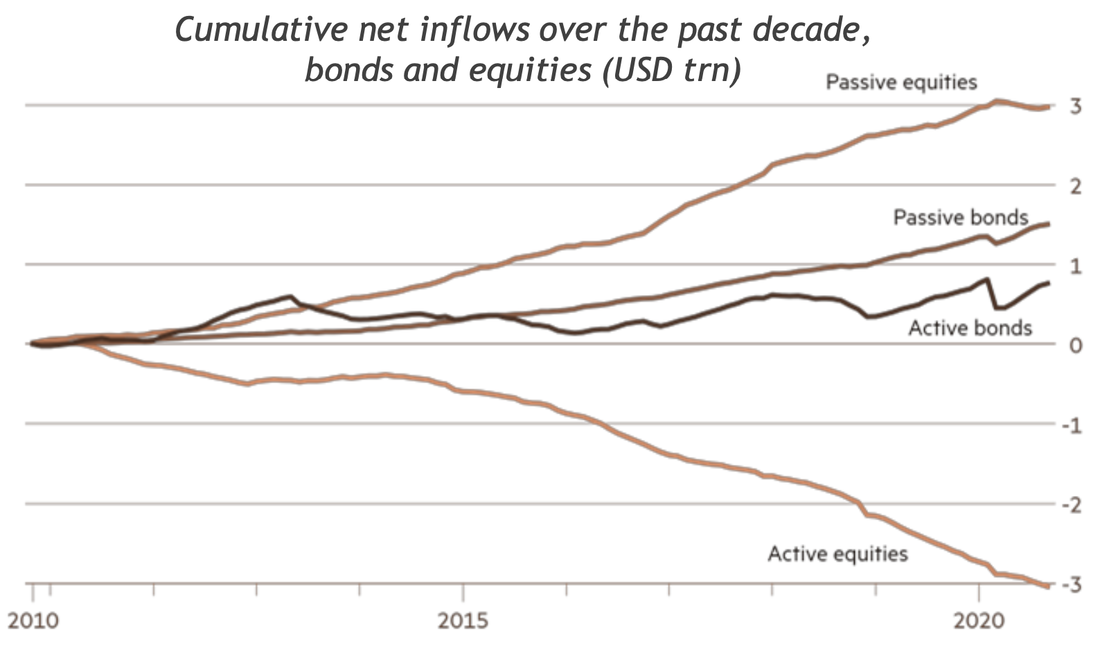 Figure 9. Active outflows, passive inflows, Source: FT.com Conclusion The market has been driven mostly by a very small number of tech giants over the last years, even if it got broader recently. In this viewpoint, we highlighted the risks to a continuation of that trend. This is a risk particularly for passive investors and index huggers. On top of that, speculative action in markets has increased, and regulatory changes are becoming more likely. Hence, investors need to weigh those risks going forward carefully, keeping in mind the potential rotation away from tech. At HCP, now entering the fifth year of our strategy, we believe that our focus on high free cash flow and good balance sheets is also a measure of risk control. The digital innovation push triggered by the pandemic may very well lead to an increase in productivity, leading to a new wave of growth out of this crisis and propel the market further up. We are looking forward to a stabilization and healthy recovery of cash flows and earnings in 2021. 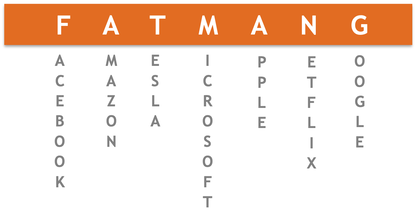
Legal disclaimer
This document is a marketing document and is intended for informational and/or marketing purposes. This material does not constitute an offer or solicitation in any jurisdiction where or to any person to whom it would be unauthorized or unlawful to do so. The views expressed are the views of HCP Asset Management through the period ending November 2020 and are subject to change at any time based on market and other conditions. References to specific securities and issuers are for illustrative purposes only and are not intended to be and should not be interpreted as recommendations to purchase or sell such securities. This Product does not represent a participation in any of the collective investment schemes pursuant to Art. 7 ff of the Swiss Federal Act on Collective Investment Schemes (CISA) and thus does not require an authorization of the Swiss Financial Market Supervisory Authority (FINMA). Therefore, Investors in this Product are not eligible for the specific investor protection under the CISA. Moreover, Investors in this Product bear the issuer risk. This Product is linked to a notional dynamic basket, which is actively managed in the sole discretion of the Reference Portfolio Advisor pursuant to the Portfolio Description Document. This document (Final Terms) constitutes the Simplified Prospectus for the Product described herein; it can be obtained free of charge from UBS AG, P.O. Box, CH-8098 Zurich (Switzerland), via telephone (+41-(0)44-239 47 03), fax (+41-(0)44-239 69 14) or via e-mail ([email protected]). The relevant version of this document is stated in English; any translations are for convenience only. For further information please refer to paragraph «Product Documentation» under section 4 of this document. ... do balance sheets matter with interest rates so low? 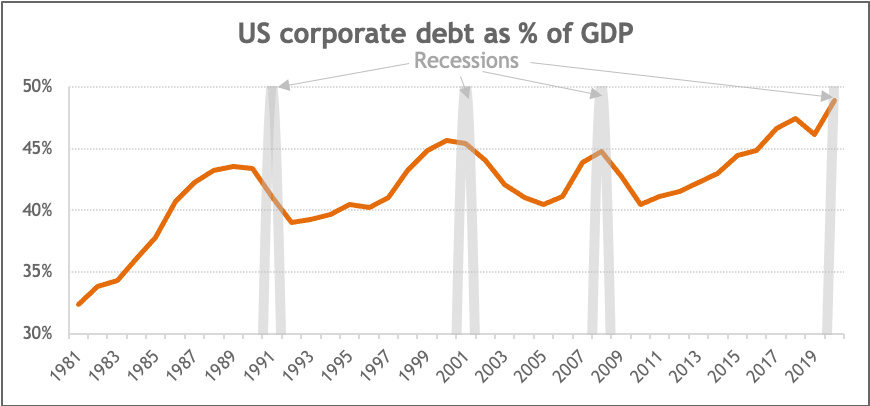 EXECUTIVE SUMMARY
Pandemic triggered stimulus … Global equities plunged over 30% in early spring due to the COVID-19 pandemic, but since then staged a miraculous recovery, fueled by an unprecedented monetary and fiscal policy response. However, the story does not end there. The longer-term effects of the lockdown and fears of a second wave create uncertainty, potentially leading to permanent job losses and a negative impact on economic output. The answer from governments is more stimulus, especially infrastructure programs – financed by debt.[1] In March, the Federal Reserve announced that it would use up to $300 billion to support the flow of credit to companies – on top of the $700 billion budget for Treasury and mortgage-backed securities – by issuing loans and purchasing investment-grade corporate bonds through an SPV.[2] Fallen angels, corporates recently downgraded from investment grade, were included in an extension of the program shortly after that. These actions saved many companies and the economy from the worst impacts of the pandemic. However, they also led to a debt bonanza. As a consequence, we see an increase in the indebtedness of corporates and sovereign states - from a level that was already historically high. [1] https://www.schwab.com/resource-center/insights/content/2020-mid-year-outlook-corporate-bonds [2] https://www.federalreserve.gov/newsevents/pressreleases/monetary20200323b.htm Figure 1. Sources: fred.stlouisfed.org, apps.bea.gov, HCP Asset Management … which is translating into dramatically higher debt levels To see the big picture, it is worthwhile to first look at the starting point before the pandemic: already high and increasing levels of debt. Figure 1 shows the rise of US corporate debt, including loans, as a percentage of the US GDP, marking recessions and the sharp increase and subsequent decline of debt levels. At the start of 2020, before the pandemic hit the world, US corporate debt was already close to 50% of US GDP. The trend of increasing corporate indebtedness is not a US specialty; it is a global phenomenon. Figure 2 demonstrates the increase of global net debt to EBITDA (proxied by the MSCI World Index), hitting an all-time-high of 2.7x in the 2nd quarter of 2020. 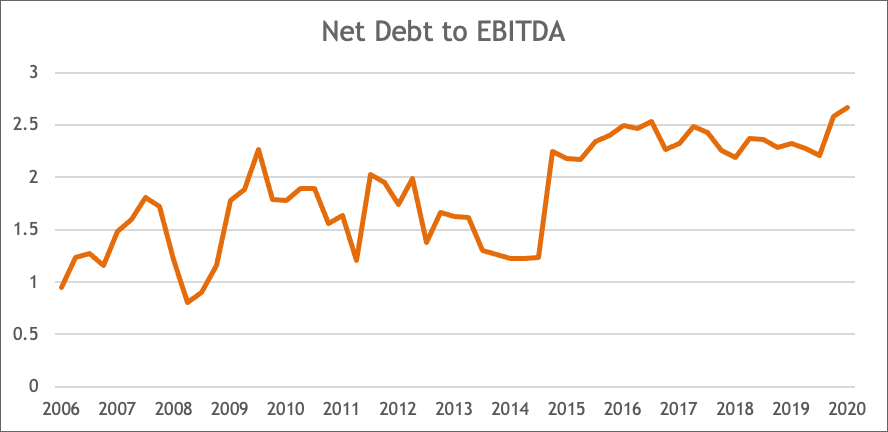 Figure 2. Sources : Bloomberg, HCP Asset Management During the pandemic, as part of the fight to save the economy and most importantly, jobs, many companies issued new debt securities taking advantage of the FED’s promise to purchase corporate bonds. New issuance of corporate bonds increased by 79% in the first eight months of 2020, compared to the same period last year. Between March-August 2020 US firms issued new bonds for over $1.2 trillion, 15% of which fall in the high yield category according to the data of SIFMA, the American trade association. Issuance of junk bonds hit a new record with over $50 billion in June, beating by far the last monthly record of $40.8 billion in September 2012.[1] [1] https://www.marketwatch.com/story/sales-of-junk-bonds-hit-record-in-june-as-debt-saddled-corporations-rush-to-raise-cash-2020-06-30 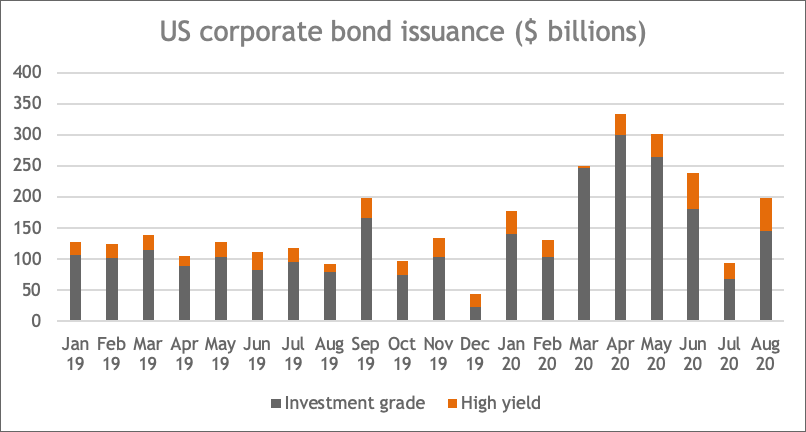
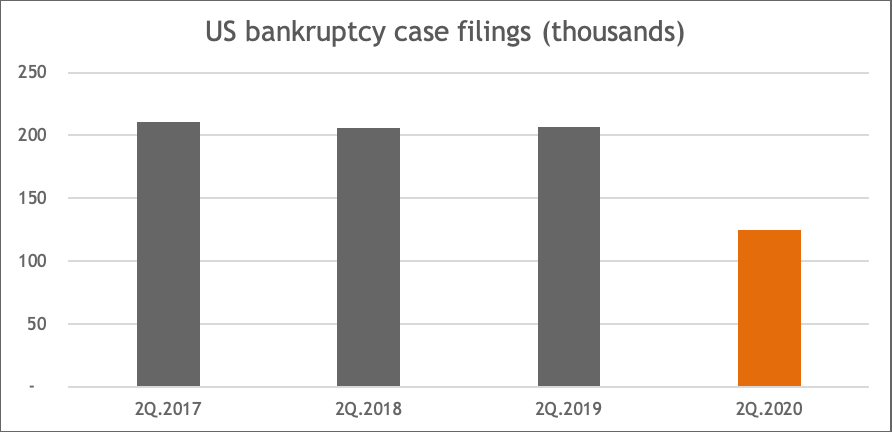
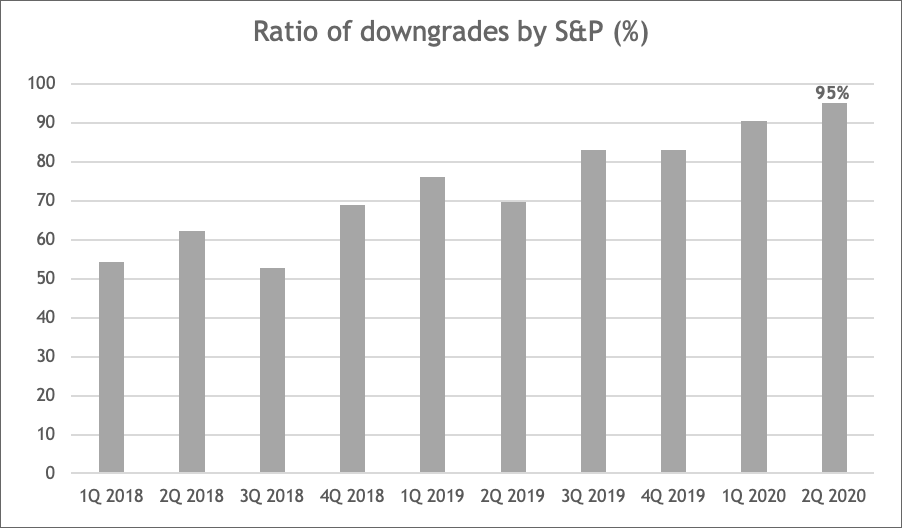 Figure 5. Zombie companies on the rise! Another reason for worry is the constant rise of zombie companies: Their ratio increased from 2% in the '90s to 8% in 2018, and spiked lately to 18-20%, a number indicating serious, postponed problems. Reduced financial pressure and low interest rates are the hotbed of zombie stocks, typically associated with weak productivity and debt bubbles. The presence of zombies is harmful to the economy as they use valuable resources unproductively, crowding out more productive companies and slowing down general growth. Based on the above warning signs – increasing debt, missing bankruptcies and zombies -, we should not be surprised to see the numbers of distressed companies rising in the coming quarters. In government stimulus we trust? The future development of the economy – especially in case of a second wave of the pandemic - depends massively on the injection of further support coming from governments and central banks. The issue is that sovereign debt levels are also hitting records, with record sovereign credit downgrades and defaults at the same time. How are public authorities to finance the economy, keeping promises of stimulus and gigantic infrastructure projects for the long-term? Countries reliant on commodities or tourism are especially endangered. Argentina, Ecuador and Lebanon already have defaulted on sovereign debt this year, equaling the record high of 3 defaults in 2017 by Fitch. The agency downgraded 29 countries in the first four months, out of which eight are now rated CCC or worse, with a low chance to avoid default. Fitch expects more defaults to occur this year and warns that a sharp increase in sovereign debt may be a sign of coming troubles. Sovereign debt relative to GDP of the leading developed countries such as Japan, US, UK, Italy, France – selected as examples – are all increasing. The recent uptick of the ratio shows that the COVID-19 crisis caused governments to increase their debt burden, while GDP is shrinking significantly. Optimists argue that there is more room before all countries reach the levels of Japan, and the Fed is willing to finance the US deficit by buying back the issued debt. Only history will tell how this large-scale experiment ends. 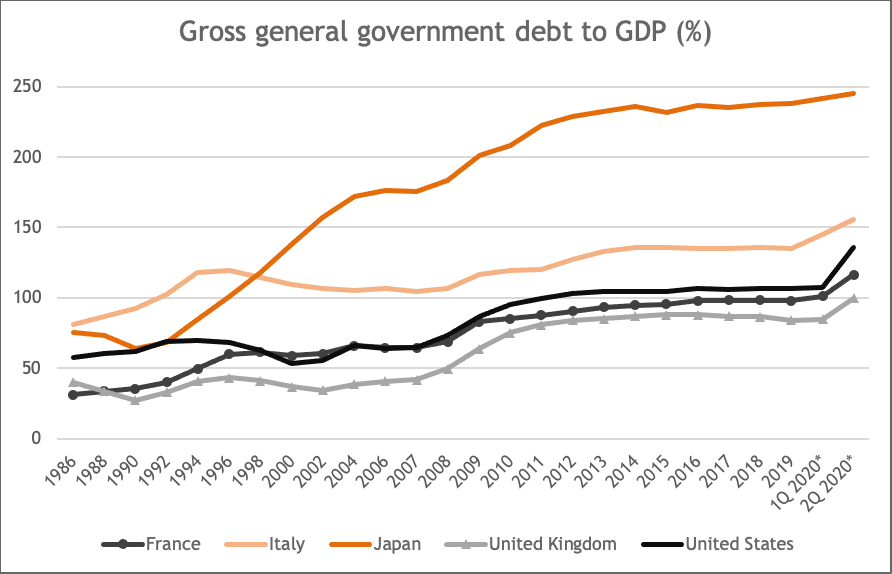 Figure 6. Sources: IMF and other sources, HCP Asset Management (for Q1, Q2 2020 which are partially estimates). Balance sheets matter Companies with great balance sheets have outperformed the overall market since its February high and its subsequent low on March 23. The universe of firms with no net debt outperformed the MSCI World by 9 % since the March 23, 2020 low, and even 12% since the Feb 12, 2020 high.[1] HCP focusses on precisely this balance sheet quality; it is at the heart of our approach. We believe that balance sheet quality will become of even greater relevance going forward. Conclusion The global economy is floating on a sea of increasing and deteriorating corporate and sovereign debt – investors need to be very careful. Now up to one out of five companies is estimated to be a zombie and might be the next one to go bankrupt. Governments are playing a risky game, with defaults and downgrades hitting new records in modern history – nobody can tell how long they can keep the economy floating. Today, investors deeply care about sustainability: how is this level of indebtedness to be sustained or managed long term? However, how is the current level of debt compatible with good governance, the “G” in ESG? ESG must also incorporate the analysis of debt levels. Furthermore, how can we expect passive investments to perform well if the economy is floating on printed debt? Active management seems better positioned to pick the right, healthy firms and thus avoiding the most indebted firms. The HCP strategy is to focus on companies with healthy balance sheets as we believe that in a debt bubble, investors should not give up on quality even if debt service levels are low. As we have shown, the market seems to agree. Learn more about our strategy at www.hcp.ch [1] Source: Bloomberg, Universe: Companies with net cash and a market capitalization of 1 bn USD or more Legal disclaimer This communication is issued by HCP Asset Management S.A.(”HCP”). This communication is provided for informational purposes only and does not constitute an offer or a recommendation to purchase or sell any security or service. It is not intended for distribution, publication, or use in any jurisdiction where such distribution, publication, or use would be unlawful. This communication does not contain personalized recommendations or advice and is not intended to substitute any professional advice on investment in financial products. Investments are subject to a variety of risks. Before entering into any transaction, an investor should consider carefully the suitability of a transaction to his/her particular circumstances and, where necessary, obtain independent professional advice in respect of risks, as well as any legal, regulatory, credit, tax, and accounting consequences. Past performances is no guarantee of current or future returns, and the investor may receive back less than he/she invested. This communication is the property of HCP and is addressed to its recipients exclusively for their personal use. It may not be reproduced (in whole or in part), transmitted, modified, or used for any other purpose without the prior written permission of HCP. The contents of this communication are intended for persons who are sophisticated investment professionals and who are either authorised or regulated to operate in the financial markets or persons who have been vetted by HCP as having the expertise, experience and knowledge of the investment matters set out in this document and in respect of whom HCP has received an assurance that they are capable of making their own investment decisions and understanding the risks involved in making investments of the type included in this communication or other persons that HCP has expressly confirmed as being appropriate recipients of this communication. If you are not a person falling within the above categories you are kindly asked to either return this document to HCP or to destroy it and are expressly warned that you must not rely upon its contents or have regard to any of the matters set out in this communication in relation to investment matters and must not transmit this communication to any other person. This communication contains the opinions of HCP, as at the date of issue. The information and analysis contained herein are based on sources believed to be reliable. However, HCP does not guarantee the timeliness, accuracy, or completeness of the information contained in this communication, nor does it accept any liability for any loss or damage resulting from its use. All information and opinions as well as the prices indicated may change without notice. Neither this document nor any copy thereof may be sent, taken into, or distributed in the United States of America, any of its territories or possessions or areas subject to its jurisdiction, or to or for the benefit of a United States Person. For this purpose, the term "United States Person" shall mean any citizen, national or resident of the United States of America, partnership organized or existing in any state, territory or possession of the United States of America, a corporation organized under the laws of the United States or of any state, territory or possession thereof, or any estate or trust that is subject to United States Federal income tax regardless of the source of its income. Source of the figures: Unless otherwise stated, figures are prepared by HCP. Although certain information has been obtained from public sources believed to be reliable, without independent verification, we cannot guarantee its accuracy or the completeness of all information available from public sources. Views and opinions expressed are for informational purposes only and do not constitute a recommendation by HCP to buy, sell or hold any security. Views and opinions are current as of the date of this communication and may be subject to change. They should not be construed as investment advice. No part of this material may be (i) copied, photocopied or duplicated in any form, by any means, or (ii) distributed to any person that is not an employee, officer, director, or authorised agent of the recipient, without HCP Asset Management S.A. prior consent. ©2020 HCP Asset Management S.A.. All rights reserved
The world has seen unprecedented disruption from technology in many sectors, as major trends such as Cloud Computing, Big Data and Internet of Things converge to what some say is the fourth industrial revolution. Therefore, we are living in really interesting times as the change seems to accelerate.
Fourth industrialization impacts asset management Now this trend is also reaching asset management. The Finance sector, in particular the asset management industry, has broadly been slow to adapt this change. The industry has enjoyed comfortable margins for many years and has therefore not been forced to optimize its processes. Operating margins in the asset management industry have been in the thirties for the last years. On top of that, running an asset manager requires very little capital since employees are the key assets and capital expenditures can be low (basically offices and IT equipment). Consequently, the return on invested capital is high. No wonder that we have seen many players from banks over insurers to new boutiques entering the space offering products to clients. This lead to a situation where for example in Europe there exist more equity funds than listed stocks. The industry is furthermore very fragmented with no player having more than a ten percent global market share in terms of assets managed. When technology hits, the change can be rapid However, we have seen technology already making inroads into asset management with examples such as Exchange Traded Funds (ETFs) using technology to easily replicate indices or the rise of the Internet triggering transparency on products, performance and styles. In our view, the industry is just about to see now the full impact of technological change. Despite rising equity and bond markets over the last couple of years, fees already came under pressure, and we see even zero fee funds being offered as core products commoditize. In 2016, all net inflows into US based equity funds went into passive on the expense of active managers, and the trend has continued in the first half of 2017 despite equity markets on a run. In Europe, the trend to passive investments has started later and is less advanced. Roughly 15 % of the net inflows in the first half of 2017 and half of all equity net inflows went into ETFs. In Europe, roughly 6 % of all assets in the mutual fund industry are invested in ETFs, well below the level in the US. In the US, over the last ten years more than US-$ 1 trillion changed from being invested actively in equities to being passively invested. Especially Vanguard as specialist for passive investing is profiting from this trend but also ishares, the division of Blackrock, the world largest asset manager. This trend is hitting margins and we are seeing active managers cutting fees. Given the speed of change, the industry needs to find new efficiencies fast. That is why we finally see the industrialization of asset management coming. Blockchain technology on the front door In the search for efficiencies, new technologies such as Blockchain could be interesting. Isn't it an anachronism that we can deliver milk in one hour but shares settle three days later? While the technology is still nascent the potential is enormous. In theory, shares may be immediately settled once the transaction is initiated. Reconciling transactions, checking cash status or the identity of the buyer are all examples of applications which will be normal one day on the Blockchain. However, in the short run there are many more inefficiencies in a still very paper based industry which can be addressed. Other industries such as retail have optimized their processes for years by using a modular approach. We expect this to be on the forefront of industry efforts in the coming years versus Blockchain technology to be more a longer term project. Are the tech giants taking over? Are the Alphabets and Amazons about to take over in asset management like they did in advertising or retail? We believe that this is a potential longer term threat if the industry does not act and modernizes itself. However, in the short term those tech giants have easier targets given that the finance industry is highly regulated and requires an approach which varies by country. Uberization Some think that Uberization stands for tech companies replacing banks and asset managers. In our view, Uber stands though for the 'gig' economy, for a highly efficient, mostly outsourced operation that uses the latest technology and increases the efficiency of underutilized assets. Netflix or Apple demonstrated what ease of use means, Tesla shows that your product feels fresher if your car comes with a regular software update. Hence, the Uber Moment of Asset Management will create an avalanche of new, easy to handle tools and new players who are betting on this technology are likely to gain share. Death for funds? The technological change will allow to create fully personalized products. This bears the question if those products are still be funds or other customized vehicles to save money. This is only one example of how drastic the asset management industry is about to change. The new efficiencies to be found will likely be good news for the investors as saving money becomes cheaper in this process. However, very similar to other industries a massive change will end the state of deep slumber asset managers have been in. The world has seen unprecedented disruption from technology in many sectors, as major trends such as Cloud Computing, Big Data and Internet of Things converge to what some say is the fourth industrial revolution. Now this trend is reaching asset management.
Our predictions Our predictions for asset management in this new world are:
The Finance sector, in particular the asset management industry, has broadly been slow to adapt this change. One reason for this is that the sector is quite conservative but it is also in our view due to financial regulation actually protecting the incumbents. Technology had already an impact However, we have seen technology making inroads into asset management. Let us list three examples:
Zero fee funds coming? In our view, the industry is just about to see the full impact of technological change. Despite rising markets over the last couple of years, fees already came under pressure. This likely has been only the early inning as they say in baseball, and we may see even zero fee funds being offered. Commoditized offerings simply cannot be differentiated by definition and the price approaches the cost. According to Morningstar 70 % of all net flows in equities went into passive products in 2015, hence this trend is affecting the whole industry. Passive funds have typically lower fees than actively managed funds and reached already a 40 % market share in the US fund market for equities. Industrialization next stop Where is threat, there is also opportunity for agile players. The industry is mostly still not using the latest technology, has not cut all the processes into modules and automatized them as the manufacturing sector did many, many years ago. Here, new technologies such as Blockchain could be helpful. While the concept may be close to its peak in terms of the Gartner hype cycle, we see a lot of areas where the technology can be applied. Isn't it an anachronism that we can deliver milk in one hour but shares settle three days later? Will the Alphabets and Amazons take over? We do not think so as those companies have other, easier targets first. Finance is highly regulated and complex, and you need domain expertise to be successful. However, the asset management industry could profit from implementing the customer centric obsession tech companies demonstrate. Where is the Amazon type recommendation engine for financial products? Uberization Some think that Uberization stands for tech companies replacing banks and asset managers. Yes, firms such as Alibaba have demonstrated their ability to raise $ 100 bn quickly via using their platform. Uber stands though for the 'gig' economy, for a highly efficient, mostly outsourced operation that uses the latest technology and increases the efficiency of underutilized assets. Netflix or Apple demonstrated what ease of use means, Tesla shows that your product feels fresher if you car comes with a regular software update. Hence, the Uber Moment of Asset Management will create an avalanche of new, easy to handle tools and new players who are betting on this technology are likely to gain share. They did not believe it in the taxi and hotel industry before it was too late. Be warned it may happen also in asset management! There are many more themes we could address here but leave them for a later blog post (please visit www.hcp.ch). For those in Switzerland, please feel free to attend my presentation at the CFA events in Zurich and Geneva this week. Bolko Hohaus, CFA; HCP Hohaus Advisory HCP Hohaus Advisory is a company based in Switzerland focussing on state of the art, innovative asset management solutions. |
AuthorBolko Hohaus Archiv
December 2023
Categories |
||||||||||||||||
 RSS Feed

Copyright © 2016-2023 HCP Asset Management SA. HCP is a registered trademark of HCP Asset Management SA.